Data Visualisations: Estimating COVID-19 related learning losses and effects of mitigation
Modelling projected learning losses and the learning effects of different mitigation strategies can help education leaders plan for school reopening that prioritises learning.
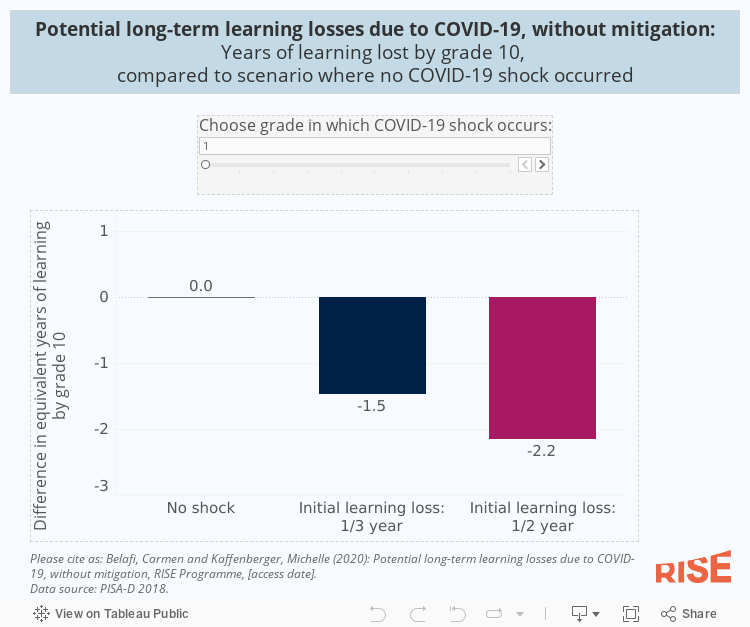
The following visualisations model the long-term consequences of the initial, temporary COVID-19 related school closures and different mitigation scenarios. They examine two different possibilities for initial learning loss, one third and one half of a year’s worth of learning, to reflect varying durations of school closures observed in different countries in 2020, and display the long-term effect of different mitigation strategies on each option for initial learning loss. Users can choose a specific grade-level cohort as the extent to which the shock impacts children’s learning trajectories depends on the grade level they were in when COVID-19 caused schools to close.
Data dynamics explained
Why are estimated learning losses more severe for children in lower grade levels?
For children in lower grade levels today, there are more years across which the losses can accumulate. Hence, they stand to lose the most in long-term learning.
Why might these estimates of long-term learning loss be conservative?
The simulations could underestimate actual long-term learning losses because they do not incorporate additional dropout from children not returning to school, the educational implications of new household financial constraints due to the COVID-19 economic shock (from lower employment, reduction in remittances, etc.), or reductions in public education budgets.
Why are long-term learning losses for the later grades smaller than the initial shock?
The accumulated learning loss depicts the average learning loss of all children, whether in or out of school. From Grade 7 onwards, the long-term learning loss is smaller than the initial learning loss. For instance, in Grade 8, half a year of initial learning loss produces 0.3 years’ worth of learning loss by Grade 10. This is because in higher grades, there are two dynamics at work:
First, there are more children who have already dropped out of school, and therefore are not affected by the COVID-19 school closure shock. Somewhat counterintuitively, the fact that their learning ‘loss’ is zero, because they were not in school anyway, brings the average loss down. The second dynamic is that in the higher grades, a higher share of in-school children is not learning. These children fell behind the level of the curriculum even before COVID-19 school closures and were not learning despite being in school. Similar to children who had dropped out, these children’s learning, therefore, was not affected by the closures. Similarly, counterintuitively, the ‘zero’ impact of the school closures on their learning reduces the average impact across the cohort.
Data dynamics explained
In Grades 7 and higher, for the ‘half a year lost’ scenario, the data indicates that short-term remediation produces less learning than a scenario of no mitigation. Can this be accurate?
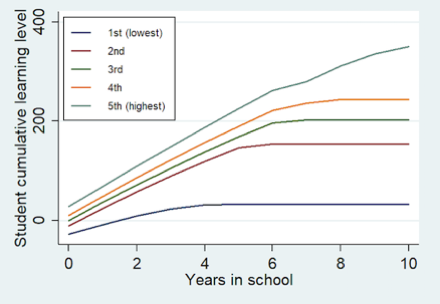
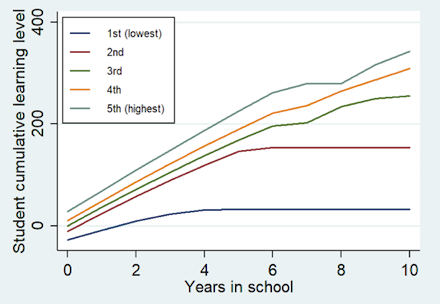
Yes, and this is an important dynamic. Remediation slows the pace of instruction to help children “catch up”. This can, in fact, harm the learning of top performers if they learn less as a result, and this is exactly what we see play out. By helping lower performers catch up, remediation puts the highest performers on a lower learning trajectory for their remaining years (see green trajectory in Figure 1). When disaggregating learning profiles by performance quintiles, they show that in the short-term remediation scenario, the top quintile learns less in this scenario compared to the no mitigation scenario, while middle performers do better with remediation than without. The two lowest-performing quintiles have dropped out and are therefore unaffected both by the COVID shock and by the remediation (we assume in the model that the lowest performers dropout first). Because so many children have dropped out by Grade 7, the gains to the middle performers who remain in school (the yellow and green trajectories in Figure 1) are not sufficient to counter the losses in learning for the top performers. In the earlier grades, more low-performing children are in school and benefit from remediation, counterbalancing the losses to high performers so that there is a net gain across the distribution.
Figure 1: Learning profiles by quintile for a shock in Grade 7, under different mitigation scenarios
No mitigation
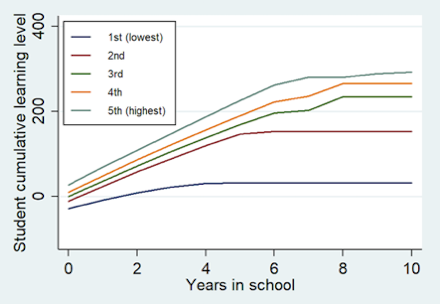
Short-term remediation
Long-term reorientation
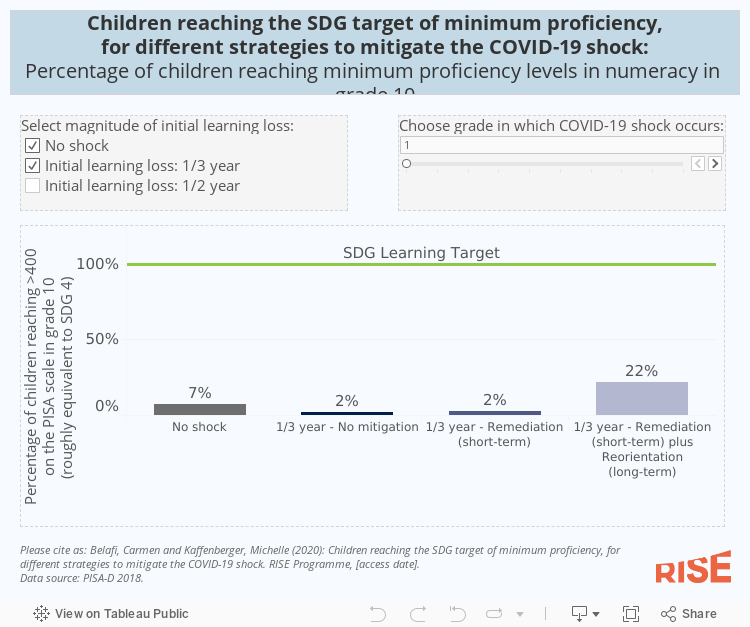
Children reaching the SDG target of minimum proficiency, for different strategies to mitigate the COVID-19 shock
Data dynamics explained
For the later grades, some of the data indicate that short-term remediation is less effective than no mitigation for children achieving the SDGs. How can this be?
See explanation above. Short-term remediation decreases learning for top performers who make up the bulk of children reaching the SDGs. While middle performers do better with remediation than without, even with remediation they cannot reach the SDG target.
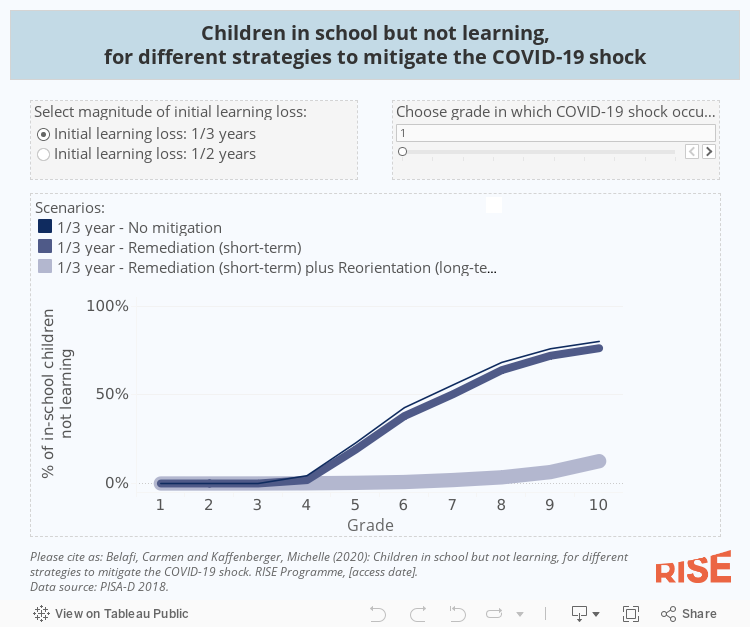
Children in school but not learning, for different strategies to mitigate the COVID-19 shock
As children re-enter school, most will be behind the level of the curriculum. Without remediation, they will continue falling further behind and may eventually stop learning. This visualisation shows the percentage of children who are in school and not learning for each scenario. (Note that this means the denominator here is in-school children.)
Data dynamics explained
In the ‘half a year lost’ scenario, in the higher grades, there are more in-school children learning nothing under the short-term remediation scenario than the no mitigation scenario. Why is this the case?
See explanation above and Figure 1. We illustrate the dynamics of this situation with learning profiles for different mitigation strategies for a scenario where the COVID-19 shock occurred in Grade 7.
Under the ‘no mitigation’ scenario, the top performers keep learning upon returning to school, but all other quintiles are too far behind, due to learning loss during the closures, and do not resume their learning when schools reopen (see the flat learning profiles for all but the top quintile in figure below).
In the short-term remediation approach, the second and third highest quintiles of learners benefit from the remediation in Grade 8, but when the curriculum resumes back to ‘normal’ in Grade 9, this jump in level of instruction between Grades 8 and 9 is too large for these children to keep learning from Grade 9 onwards. These mid-performers benefit from remediation while it is taking place, but after it ends, they can no longer keep up and consequently stop learning. At the same time, the top performers learn less in this scenario than in the ‘no mitigation’ scenario, because remediation has slowed instruction too much for them. This further contributes to the rise of the share of in-school children who are not learning anything.
Combining short-term remediation with long-term reorientation significantly benefits the top and mid-performers, resulting in an overall increase in learning and decrease in the share of in-school children learning nothing. For the later grades, these findings suggest that remediation alone is not sufficient to mitigate learning losses, making reorientation of the curriculum critical to boosting learning through Grade 10.
More details on the simulations
Why is it necessary to model learning losses?
COVID-19 could cause severe and long-term learning losses that far exceed the actual time schools have been closed, because learning losses can continue to build up after children return to school.
When schools reopen, students will be behind the expected level of curriculum. This is both because of missed learning while schools were closed, and because in many education systems, curriculum and instruction were already overambitious before the COVID-19 crisis. Curriculum and instruction often are not well-adapted to children’s actual learning levels, therefore many students were already behind before COVID-19 forced schools to close.
Without remediation to help children catch up, they can continue to fall further and further behind even after returning to school. For example, children who have not mastered foundational skills like literacy and numeracy cannot engage in lessons that require these skills. Even when children are no longer missing school, they may continue to miss new learning content. In this way, initial, short-term learning losses can accumulate to significant, long-term learning losses if no mitigating action is taken. Modelling projected learning losses and the learning effects of different mitigation strategies can help education leaders plan for school reopening that prioritises learning. Top ↑
How does this model estimate long-term learning losses?
The visualisations are based on the Pedagogical Production Function model introduced in Kaffenberger and Pritchett 2020. The model is calibrated to replicate the PISA for Development (PISA-D) results for the first seven low- and middle-income countries for which data were available. Kaffenberger 2020 applies the same model to simulate the potential long-term learning losses caused by the COVID-19 shock. The model simulates the potential long-term learning losses from school closures without mitigation and under two approaches to mitigation. Top ↑
Which mitigation approaches does the model simulate?
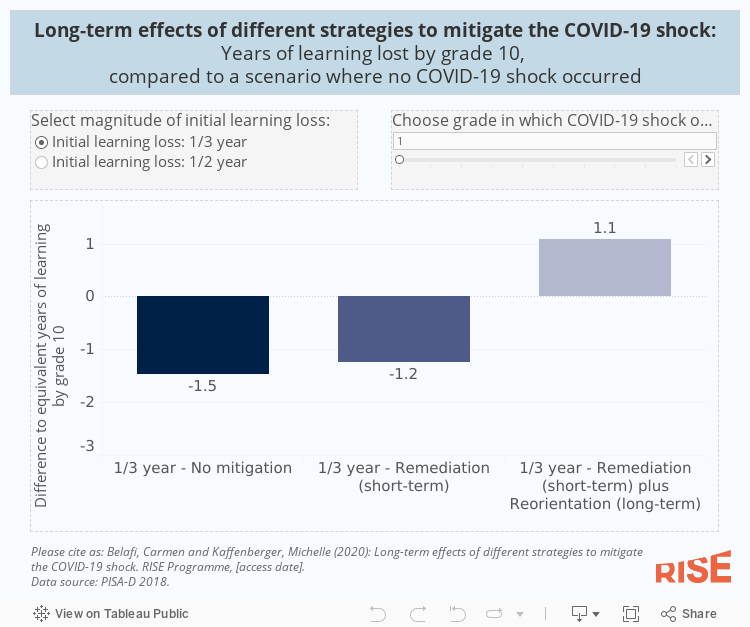
The default scenario of no mitigation assumes there are no short-term or long-term efforts taken to make up for the initial learning loss during the shock. The level of instruction and curricular pace resume to pre-COVID-19 levels once schools reopen.
The first mitigation approach is short-term remediation where children receive adapted instruction in the year they return to school before reverting to the ‘normal’ (i.e. pre-COVID) curriculum level and pace in the years that follow. For instance, children who lose a third of a school year in Grade 3 will spend a third of Grade 4 covering the remainder of the Grade 3 curriculum before starting on Grade 4 content. In Grade 5, instruction then moves to the pre-COVID, Grade 5 curricular level and pace. Strictly speaking, the model delays the ‘jump’ in the curriculum by one year. Ideally, however, part of the short-term remediation efforts would also include streamlining and prioritising of the most important content during the first year children return to school. This would maximise the amount of instruction time and minimise the jump back to pre-COVID curricular pace and level of instruction in the following year. As the model does not take this prioritisation into consideration, it likely underestimates the benefits of short-term remediation to mitigate long-term learning losses, for educational contexts where teachers and schools have the resources and autonomy to implement such streamlining.
The second, long-term reorientation approach includes both short-term remediation, as described in the previous paragraph, and then in subsequent years slows the pace of curriculum so instruction becomes more adapted to children’s learning levels. This effectively 'reorients' curriculum to better align with children’s learning and produce more learning and learning for more children each year. This matters because the official curriculum in many countries is overambitious relative to children’s actual opportunities to learn over the course of their school careers. Top ↑
Figure 2: Illustration of instruction under different scenarios, assuming a magnitude of a one third of a year of initial learning loss and a shock in Grade 3
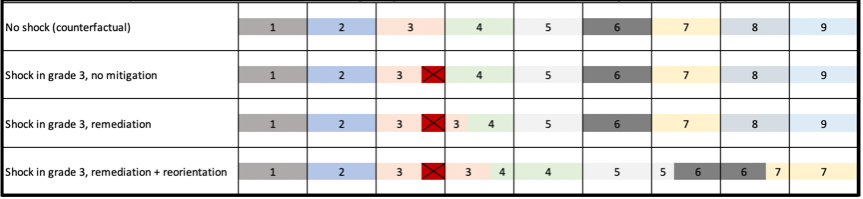
Each box represents a school year; the colours and numbers indicate the curricular content covered in the respective years.
View the simulations in Spanish
The RISE simulations of COVID-19 learning losses under different mitigation scenarios are now available in Spanish via Argentinos por la Educación.