Louise Yorke
University of Cambridge
Insight Note


Research for Equitable Access and Learning (REAL) Centre, University of Cambridge
As part of the RISE Ethiopia research programme—a study following the education progression and learning of primary school students in Ethiopia over the course of five years—we have included a number of scales intended to capture aspects of students’ ‘socio-emotional learning’ and ‘social-support for learning’ in our large-scale school survey (2018/19). We propose that considering both aspects of students’ socio-emotional learning and social support for learning—in addition to foundational skills in numeracy and literacy—can help to move towards a more expansive and holistic understanding of learning, drawing attention to processes of learning and the role of the environment within which students are located both inside and outside the school.
Socio-emotional learning is understood as encompassing a wide range of skills and attributes that are both intrinsically important and have a role in influencing children’s development and outcomes. Specifically, we consider two broad aspects of socio-emotional learning, including the ability of students to achieve goals (student effort) and the ability to develop interpersonal skills that are vital for school, work, and success in life (social skills) (Duckworth and Yeager, 2015; Elias et al., 1997). In terms of the social support that students receive for learning, we are interested in the important relationships that enable and enhance students’ learning, recognising that learning is an interactional process that takes place both within and beyond the school setting. We focus on teacher-student relationships and family support for learning.
While a growing body of evidence has captured the importance of students’ socio-emotional learning and social support for learning in the Global North, so far, existing research on students’ socio-emotional learning in the Global South is limited. Capturing these skills and attributes is not straightforward since they are largely unobservable. In addition, most scales that have been developed originate in the Global North. In this paper, we outline our emerging strategy for capturing student socio-emotional learning and social support for learning in the context of Ethiopia, which may have relevance for other researchers seeking to explore this area of study in Ethiopia or in other related contexts. We present an overview of this strategy in Table 1 below and describe this process in detail in this paper. We seek to outline some of the achievements and challenges that we encountered during this process, with the aim of helping to inform future work in this area. In the next section, we outline our rationale for focusing on students’ socio-emotional learning and some of the challenges in measuring students’ emotional learning. We then move on to discuss our emerging strategy for measuring students’ socio-emotional learning in Ethiopia.
Students’ socio-emotional learning broadly refers to the acquisition of a range of different skills and attributes which are important for students’ development, with terms such as ‘socio-emotional learning’, ‘non-cognitive skills’, ‘psychosocial skills’ and ‘21st century skills’ often used interchangeably to refer to this conceptual space (Duckworth and Yeager, 2015). In addition to this variety of terms, there are also a range of different frameworks and approaches to capturing students’ socio-emotional learning.1 Socio-emotional skills are understood as being both intrinsically important in and of themselves, and being closely associated with students’ academic learning (e.g., numeracy and literacy) (Adams, 2012; Brunello and Scholtter, 2010; Dercon and Krishnan, 2009). While researchers generally avoid establishing a direct line of causality between socio-emotional learning and academic learning, it is thought that gains in one domain are closely linked with gains in the other (Adams, 2012; Brunello and Scholtter, 2010; Dercon and Krishnan, 2009; Gutman and Schoon, 2013; Heckman, 2007). In addition, it is believed that supporting students’ socio-emotional skills may help to remediate for deficits in academic learning, especially since socio-emotional skills are more malleable than cognitive skills across the lifespan (Borghans et al., 2008). On completion of education, socio-emotional skills have been found to influence the entry of individuals into the labour market (Caspi et al., 1998). Taken together, understanding more about children’s socio-emotional skills—both as an outcome and an indicator—might provide insights into the benefits of education beyond the essential skills of numeracy and literacy and helping to achieve a more holistic understanding of the process of learning inside and outside of school.
In summary, the benefits of focusing on students’ socio-emotional learning include:
In addition to focusing on aspects of students’ socio-emotional learning, we have also included a focus on the social support that students receive for learning, which we understand as particularly important in relation to the RISE Ethiopia research. First of all, the development of socio-emotional skills is understood as being heavily influenced by the environment in which students are located and the interaction that they have with others (e.g., Dercon and Krishnan, 2009). As such, capturing both aspects of students’ socio-emotional learning in combination with the support that they receive for learning is particularly pertinent. Secondly, understanding the support that students receive for their learning is particularly important in relation to the learning and achievement of the disadvantaged, an important priority of the RISE Ethiopia research study. Thirdly, given the important role of interpersonal relationships within the Ethiopian context, exploring how social supports influence students’ learning is appropriate. Having outlined our rationale for focusing on students’ socio-emotional learning and support for learning, we now consider some of the challenges of measuring and capturing students’ socio-emotional learning and development.
In seeking to understand and study the development and impact of students’ socio-emotional learning, challenges arise since these skills are largely unobservable. As such, socio-emotional skills are generally measured using latent constructs which are inferred (statistically) through variables that are observed and measurable. To measure socio-emotional skills, we must first identify a set of behaviours which we believe (based on theory and evidence) capture the socio-emotional construct in which we are interested, but this poses both theoretical and psychometric challenges. First, we must ensure that the behaviours that we identify accurately reflect the underlying construct within the cultural contexts in which we are interested. Secondly, we must ensure that the scales that we develop are parsimonious and demonstrate good psychometric properties including score reliability and score validity. Ensuring that the behaviours that we identify accurately reflect the underlying construct within the cultural contexts in which we are interested is hugely important.
Currently, existing scales aimed at measuring children’s socio-emotional learning are largely developed in the Global North, so their cultural context is often very different from those of developing countries. Very few scales originate from developing country contexts, including Ethiopia, and research on the socio-emotional development of children and young adults in developing country contexts is still an emerging area, especially in relation to their educational outcomes. This might be due in part to the many challenges involved in measuring socio-emotional scales in such contexts. Notable exceptions include the Young Lives study,2 which has included measures of students’ psychosocial skills across its four country contexts, and the Resilience Research Centre,3 which explores socio-emotional skills across both the Global North and South. Yet at the same time, while these research studies focus on developing socio-emotional scales across these different developing country contexts, even among different cultural contexts the conceptualisation and development of socio-emotional skills is likely to be very different. Rather, approaches to understanding the development and acquisition of socio-emotional skills should be grounded in the particular familial, social, cultural, and ecological context of that country (Kim, Yang and Hwang, 2006).
Recognising the importance of cultural relevance in the scales intended to capture students’ socio-emotional learning, and drawing on other work (e.g., Yorke, 2013; Little and Azubuike, 2017; Yorke and Ogando, 2018) in this paper, we outline our emerging strategy for the development of scales designed to capture students’ socio-emotional learning. We included several scales to measure students’ socio-emotional development within the RISE Ethiopia4 school survey in 2018/2019. The school survey was conducted at both the beginning and the end of the school year in 2018/19 to capture progress in student learning over the course of the academic year.5 This included approximately 8,000 students in Grades 1 and 4 in 168 primary schools across seven locations (regions and city administrations). In terms of students’ socio-emotional development, we administered four scales in the end-of-year data collection (2018/19) to Grade 4 students only, including students’ social skills, academic effort, and the support that students receive from their social network members (family and teachers).
As we will outline further in this document, our ground-up approach to capturing these aspects of students’ socio-emotional learning and social support was particularly important in the current study. The skills and constructs that we identified as being important for children’s education and development in Ethiopia emerged through a number of methods and approaches, which we will further outline. We made use of a wealth of expertise and knowledge from different sources and found that combining both insider and outsider views of students’ socio-emotional development helped to provide a comprehensive and integrated approach (Kim, et el., 2006). We also sought to focus on ensuring that the scales that we developed demonstrated good psychometric properties including parsimony, reliability and validity, and structural validity. We made use of both exploratory factor analysis (EFA) and confirmatory factor analysis techniques (CFA). EFA was used during the analysis of the pilot data to help to create scales that were both parsimonious and yielded reliable scores, so that these could be used in the main data collection. CFA was used during the analysis of the main data to confirm the underlying structure of the scales and to determine whether the items in the scale are contributing to the latent variable (Ullman, 2013). In the remainder of this document, we outline our emerging strategy for the development of scales designed to capture students’ socio-emotional skills, including our overall approach and the insights and lessons that emerged from this process.
To identify what aspects of socio-emotional development and social support have most relevance for students’ development and outcomes in the Ethiopian context, we undertook several important steps. We first analysed data emerging from other strands of the RISE Ethiopia study, which included a system diagnostic that involved interviews with more than 150 government stakeholders in Ethiopia at the federal, regional, and woreda (district) level in 2018. The data emerging from the system diagnostic included: the factors that stakeholders believed most impacted students’ learning outcomes across the different regions in Ethiopia, their understandings of education quality, and what they believed was necessary to ensure that all students succeed in education. These stakeholders stressed how education and learning are declining in Ethiopia, and how a range of factors at the student, school, family, and community level impacted students’ learning and development. They emphasised the importance of students’ motivation and behaviour, the support that they received from their families, and their relationship with their teachers.
In addition, we consulted with a school principal (male) and two teachers (one male, one female) working in a disadvantaged school in Addis Ababa to gain insights into the appropriateness and relevance of our proposed approach, scales, and individual items. During this school consultation, we discussed with the principal and teachers what aspects of students’ socio-emotional learning they believed to be the most relevant constructs for Grade 4 students in their school (based on a list of identified constructs). The school principals and teachers identified the importance of students’ motivation and effort as having an important impact on students’ academic learning. They discussed the many problems that disadvantaged groups of students faced and emphasised that the social support for learning was particularly important for these students, including family support, peer support, and teacher-student relationships.
After discussing what aspects of students’ socio-emotional learning had most relevance of the target students, we then consulted with the school principals and teachers about the ability of students to comprehend and complete scales intended to capture aspects of their socio-emotional learning and social support for learning. We provided a few examples of different Likert-format scale items and asked them whether they believed Grade 4 students (who would be approximately ten years old) in their school would have any difficulty completing such items. The principal and teachers agreed that Grade 4 students would be able to respond to these types of items and suggested that students should spend approximately 15 minutes responding to these questions.
Following the school consultation, we (authors) engaged in internal discussions with other members of the RISE Ethiopia team to identify what aspects of socio-emotional skills and social support for learning were most relevant in the context of Ethiopia, drawing on team members’ extensive experience and knowledge in this area.
Compiling the information and feedback that we gathered through these various steps, we identified the following aspects of students’ socio-emotional learning and social support for learning:
| Socio-emotional learning | Student effort | Whether a student tries hard, asks for help, and/or participates in class. |
| Social skills | The skills students use every day to interact and communicate with others are important for learning. | |
| Social support for learning | Teacher-students relationship | A positive relationship between a teacher and their students is important for students’ learning outcomes. |
| Family support for learning | Support from families is important for students’ learning outcomes |
Once we had identified the aspects of students’ socio-emotional development and social support that we would focus on, we then undertook a review of the literature to identify existing scales that had been used to measure these constructs, prioritising those that had been used in other related contexts. In addition, we sought to ensure that these scales were theoretically grounded, inexpensive, freely available, and demonstrated satisfactory psychometric properties. To narrow our focus, we decided that the scales that we selected should be appropriate for Grade 4 students (approximately ten years old) and for administration with vulnerable groups (e.g., girls, children with disabilities, children living in poverty). In addition, we decided that the items within the scales should not be too complex to allow translation across multiple languages and cultural contexts in Ethiopia. From our review of the literature, we identified a total of fifteen scales that were suitable for our purposes, and from these scales we created an initial pool of items (110 items). In creating this pool of items, we decided that all items should be positively worded as difficulties have been encountered in previous studies with negatively phrased items (which is believed to be related to difficulties in translating negatively worded items [Yorke and Ogando, 2018]).
Once we had created the initial pool of items, separately, to reduce the number of scales and items in our initial pool we (authors) reviewed each item, identifying whether we should:
We then came together to compare our initial review of these items, retaining those where there was mutual agreement (see Appendix A for an example of this review process). This left us with a reduced item pool of 78 items, drawn from 14 scales.
Using this narrowed item pool, we invited three experts from Addis Ababa University who are experts in the fields of psychology and psychometric analysis to undertake a similar review of the reduced item pool, including identifying whether each item should be dropped, retained, or adapted. We (authors) then undertook a further review of the items, incorporating the results from this expert review and consulting further with members of the broader RISE Ethiopia team.
This process resulted in a final pool of seven scales and 46 items for piloting related to the different types of scales we wished to include to capture different aspects of children’s socio-emotional development (i.e. general, academic-specific, social support). For each of the scales to be piloted we ensured that there were at least 5-items per scale, with additional items added to provide room for removing items after the pilot phase (Table 2). We also considered other important aspects of the scale, such as what type of response category would be most appropriate. We decided that a 3-point Likert-format scale was the most appropriate response category for the grade four students as this would be least confusing for them to complete. We envisaged that from this list of seven scales that we planned to pilot, we would include a maximum number of four scales in the main data collection, ensuring that we retained at least one scale for the different areas of children’s socio-emotional development (i.e., general, academic-specific, social support). This was because these scales would be administered as part of the wider RISE Ethiopia school survey, and we wished to limit the time that it would take to administer the instruments to reduce the burden on the participants.
| Type | Scales | Adapted From | No. of Items |
|---|---|---|---|
| Aspects of socio-emotional learning | Social skills | Children’s Self Report Social Skills Scale (CS4) (Danielson, and Phelphs, 2003) | 7 items |
| Resilience | The Child and Youth Resilience Measure (CYRM) (Ungar and Liebenberg, 2013) | 8 items | |
| Student motivation | Children’s Multi-Dimensional Self-Efficacy Scale (Bandura, 1990) | 6 items | |
| Students effort | The Academic Self-Concept Questionnaire (ASCQ) (Liu, Wang and Parkins, 2005). | 7 items | |
| Social Support for learning | Family support for learning | The School Engagement Instrument (Appleton, Christenson, Kim and Reschly). | 6 items |
| Teacher-Students Relationships | 6 items | ||
| Peer support for learning | 6 items |
An added challenge in developing culturally relevant scales to capture students’ socio-emotional development in Ethiopia is due to the cultural and linguistic diversity of the country, where over eighty languages are spoken. In the context of our RISE Ethiopia research we aimed to administer the selected scales in eight of these different languages: Amharic, Berta, Hadiya, Oromifa, Sidamigna, Somali, Tigriniya, and Wolaytinga. To help to ensure both linguistic and cultural equivalence across these eight different languages, we undertook a careful and rigorous translation process involving a combination of approaches. Experienced translators were recruited, and they were asked to translate the instruments into the eight target languages. A few the RISE Ethiopia team members then undertook a back-translation of the instruments into English and evaluated the accuracy of these translations. Following this, we then met with the translators to discuss their interpretation of the items and to ensure that they had captured the intended meaning behind all the items.
In some cases, additional words or examples were added to clarify the meaning of items. For example, for the item, “I am polite towards others.”, examples of “greetings”, and “saying thank you” were added in all languages. In other cases, a word was substituted for a different word that was more suitable in the target language. For example, in Tigrinya it was decided that, “I feel comfortable talking to my teacher.” should be translated as, “I feel confident talking to my teacher.” In terms of the instructions for the students who would be completing these items, an informal rather than formal tone was most appropriate. We also made sure to indicate that there were no right or wrong answers to the questions being asked, to try to put the students at ease. Once we were satisfied with the translation of the items into the eight different target languages, we then finalised the scales and items to be piloted.
The items were piloted in February 2019 in Ethiopia. In total 1,533 grade four students were included in the pilot across eight different sites in Ethiopia.6 In each of the eight sites we included one urban school and one rural school. Each of the seven different scales to be piloted was divided into two separate forms (Form A and Form B) which were then administered to students.7 The pilot was conducted by 12 fieldworkers who participated in training prior to the data collection. As had been discussed during the training, all fieldworkers first provided examples of how to complete the items, providing examples of the different response categories on the black board: agree, partially agree, and do not agree. The fieldworkers then proceeded to read out each items from the different scales, and students were given time to record their responses one by one. Fieldworkers ensured that all children had understood the question before proceeding to the next item.
During the pilot data collection debriefing, we discussed with the fieldworkers their experiences of administering the socio-emotional scales and we identified any difficulties that they encountered with specific scales or items. A number of the fieldworkers found that some students considered the ‘always/sometimes/never’ response categories to be confusing because it did not always match the sense of the presented statements. Therefore, for the main data collection, we decided to change the response categories to ‘agree/somewhat agree/do not agree’. In some sites, where the fieldworkers did not speak the local language (i.e., in Benishangul Gumuz and SNNP), the teacher was asked to read out the items. However, on reflection we found that this was problematic because it violated the confidentiality of the data and in some cases, teachers were promoting students to respond to the items in a particular way. As such, for the main data collection, where the fieldworkers did not speak the local language, it was decided that they would recruit a local language speaker from the Woreda Education Office to help with communication in the regional language.
After the scales had been administered, we held an informal discussion with a small group of six students in one school in Addis Ababa who had just completed the questionnaire, to understand their experiences of completing the questionnaire. We asked them if they had understood what they had to do, how they interpreted the response categories, and what they understood by individual items. We found that the selected group of students had good comprehension of the meaning of the items and indicated that the instructions were clear and that they understood the response categories (see Appendix B). In general, they indicated that they enjoyed answering questions about themselves. For the teacher-student relationship scale, some of the students indicated that they were unsure as to whether they should response to these items in relation to a specific teacher or teachers in their school in general. They indicated that for them it was not possible to generalise to the teachers, for example, some teachers were trustworthy, and others were not. Therefore, for the main data collection it was decided that the students should respond to these items in relation to their Grade 4 Maths teacher.
To help to identify the four scales that we would retain for the main data collection (ensuring that we retained at least one scale for the different areas of children’s socio-emotional development), we reviewed the psychometric properties of the pilot data.
First, we investigated the distribution of responses across the different scales and items. As seen from Table 3, the Student Effort, Social Skills, Teacher-Student Relationships and Peer Support show the greatest variability, while the Student Motivation, Family Support and Resilience scales show the least variability. Secondly, Cronbach’s Alpha (α) was used to determine the reliability of scores pertaining to each of the scales (Table 4). All items had a positive relationship with the scales, and the average inter-item correlation was approximately .3 for each of the scales. The Cronbach’s alpha (α) for all seven scales range from 0.74 to 0.79, indicating that the scales have good internal consistency and reliability (Nunnally and Bernstein, 1994). Third, an exploratory factor analysis was conducted to assess whether all items were contributing to the small underlying trait and to ensure parsimony of the scale. Results of exploratory factor analysis indicate that all scales were typically loading on one factor, and the eigenvalues for this factor were all above the suggested cut-off point of >1 (Kaiser, 1958). This suggests that the scales are primarily measuring one underlying trait (Table 4). In summary, based on the pilot analysis, all seven scales yielded scores with good reliability and structural validity, suggesting their suitability for inclusion in the main data collection.
| Scales | N | Mean | SD | Min | Max |
|---|---|---|---|---|---|
| Social skills | 760 | 2.63 | 0.57 | 1 | 3 |
| Resilience | 743 | 2.74 | 0.53 | 1 | 3 |
| Student motivation | 747 | 2.85 | 0.41 | 1 | 3 |
| Students effort | 765 | 2.67 | 0.54 | 1 | 3 |
| Family support for learning | 1505 | 2.73 | 0.52 | 1 | 3 |
| Teacher-student realtionships | 760 | 2.62 | 0.58 | 1 | 3 |
| Peer support for learning | 741 | 2.67 | 0.59 | 1 | 3 |
| Scales | No. of Items | Cronbach’s Alpha (α) | Av. Inter-Item Correlation | Eigenvalue (1 Factor) |
Standardised Item Loadings |
|---|---|---|---|---|---|
| Social skills | 7 | .74 | .29 | 2.01 | .46 - .61 |
| Resilience | 8 | .79 | .31 | 2.56 | .51 - .61 |
| Student motivation | 6 | .76 | .34 | 2.09 | .51 - .71 |
| Students effort | 7 | .78 | .34 | 2.42 | .50 - .66 |
| Family support for learning | 6 | .77 | .36 | 2.14 | .51 - .67 |
| Teacher-student relationships | 6 | .75 | .34 | 2.03 | .45 - .64 |
| Peer support for learning | 6 | .77 | .34 | 2.11 | .53 - .65 |
In considering which scales to retain we took into consideration the psychometric functioning of the scales together with the priorities that we had identified in terms of students’ socio-emotional development in consultation with local level stakeholders. Based on these considerations we decided to retain the following four scales: Social Skills, Student Effort, Teacher-Student Relationships, and Family Support for Learning. For these scales that were retained, several adaptations were made. For the Student Effort scale, we dropped two items that demonstrated a small amount of variance. For the Family Support for Learning Scale, we removed one item due to low factor loading and rephrased some of the items from “there is someone in my family” to “there is at least one person in my family” because it was found that some students were interpreting the initial phrasing as “there is only one person in my family” and did not know what to answer if there was more than one person in their family. For the Teacher-Students Relationship scale we indicated that the students should refer to their grade four Maths teacher when completing these items. No final changes were made to the Social Skills scale.
The four retained socio-emotional scales (Social Skills, Student Effort, Teacher-Student Relationship, and Support from Family) were administered as part of the end of year school survey in 2018/19. A total of 3,084 Grade 4 students (49 percent female, 51 percent male) with a mean of 11 years old (S.D.= 1.99) from seven regional locations completed the socio-emotional scales and were included in the survey (see Table 5). Between the beginning- and end-of-year school survey, there was significant student attrition (16.2 perecent for Grade 4 students). Reasons for this significant attrition were linked to an inability to attend school due to civil conflict, schools which closed early, and/or where class rosters were not maintained, making it difficult to trace
| Female | Male | Total | |
|---|---|---|---|
| Addis Ababa | 231 | 226 | 457 |
| Amhara | 235 | 254 | 489 |
| Benishangul Gumuz | 154 | 186 | 340 |
| Oromia | 380 | 420 | 800 |
| SNNP | 125 | 129 | 254 |
| Somali | 155 | 138 | 293 |
| Tigray | 237 | 214 | 451 |
| Total | 1,517 | 1,567 | 3,084 |
Item Analysis
Following the administration of the socio-emotional items in the end-of-year school survey, we carried out an initial exploration of the data for each of the four scales. Considering the distribution of the items for each of the four scales, we found the data to be highly (negatively) skewed (see Appendix C and D). Although real world data are often not normally distributed particularly data related to socio-emotional development (Blanca et al., 2013), there might also be several factors which have contributed to the skewed nature of the data. First, there are only three response categories which might have resulted in a clustering of scores. It could be that including more response categories might have resulted in a greater distribution of scores. Secondly, the skewed nature of the data may be a result of social desirability bias (Crandall, Crandall and Katkovsky, 1965). From our consultation with students during the pilot data collection, this did not appear to be the case, however it is still a possibility as we only consulted with a very small number of students. In addition, the high level of attrition found in our sample, may have biased our sample towards students who had ‘higher’ socio-emotional skills. Perhaps the inclusion of other different groups of participants – such as who had dropped-out and/or children who had never been to school - might have provided us with a more evenly distributed range of scores. Nevertheless, deviations from normality are less serious in larger sample sizes and therefore, we are not overly concerned about the violation of normality in our data.
Reliability and Validity
Cronbach’s Alpha
The score reliability of the scales was tested considering the inter-item correlation and Cronbach’s Alpha (α)8 and the results for each scale are presented in Table 6.
| No. Items | Average Inter-Item Correlation | Cronbach's Alpha (α) | |
|---|---|---|---|
| Social Skills | 7 | .3 | .72 |
| Student Effort | 5 | .3 | .65 |
| Family Support for Learning | 5 | .3 | .71 |
| Teacher-Student Relationship | 6 | .3 | .69 |
The average inter-item correlation for each of the four scales falls within the recommended range of 0.15-0.50 (Clark and Watson, 1995). For each of the scales, Cronbach’s Alpha (α) ranges between .65 and .73 which shows adequate-high reliability for all of the scales (Taber, 2018).
Confirmatory Factor Analysis
Confirmatory factor analysis was conducted separately for each of the four scales using the asymptotically distribution free (ADF) estimation method. Selection of the estimation method should be based on the normality of the data and the sample size (Benson and Fleishman, 1994). Most of the estimation techniques assume multivariate normality and continuous variables, such as Maximum Likelihood estimation which is one of the most popular methods. As seen from the item analysis of our data, the data were highly skewed and represented ordinal rather than continuous data. Although, in large sample sizes the violation of the principle of non-normality is not so much of an issue (Huang and Bentler, 2015; Ullman, 2013). Therefore, in this case, we decided to use the ADF method. The ADF method is a form of weighted least squares and is often used to estimate parameters or test models without a normal distribution assumption on variables, including ordinal variables and works well with large sample sizes (Huang and Bentler, 2015).
The models for each scale were specified based on the hypothesised relationships. Each of the four models are not complex, with items directly loading onto the latent variable. These four specified models were then estimated and evaluated. First the standardised co-efficients for each of the items were inspected which were found to range between .4 and .7 thereby indicating that all items were contributing to the scales. The goodness-of-fit statistics were then used to determine the ‘fit’ of the data in relation to the initial models. If the results indicates a good fit, this means that the items are contributing to an underlying factor (uni-dimensionality). If the data do not fit the model, it might indicate that not all the items are contributing to the scale or that the scale is not uni-dimensional. However, the assessment of the fit of the model is not always straightforward and with large sample sizes the chi-squared (χ2) test is often statistically significant.
As such, it is suggested that multiple fit statistics are used to determine the model fit. In general, good fitting models produce consistent results on many different indices and the decision of which statistics to report is generally one of personal preference (Ullman, 2013). The comparative fit index (CFI) and root mean square error of approximation (RMSEA) are the most frequently reported fit statistics while Hu and Bentler (1999) also recommended reporting the standardized root mean square residual (SRMR). In Table 7 we have presented the chi-squared (χ2), CFI, RMSEA, and SRMR, alongside the recommended valued (Hu and Bentler, 1999).
| χ2 p>0.05 |
CFI >.95 |
RMSEA >0.06 |
SRMR < 0.08 |
|
|---|---|---|---|---|
| Social Skills | p<0.05 | .85 | .05 | .06 |
| Student Effort (Adjusted model) | p<0.05 | .96 | .04 | .03 |
| Family Support for Learning | p<0.05 | .92 | .05 | .04 |
| Teacher-Student Relationship | p<0.05 | .90 | .05 | .04 |
The CFA shows a good fit for each of the four models suggesting uni-dimensionality of the scales. In terms of the Student Effort scale, initially the model did not demonstrate good fit. Upon further inspection, there was some evidence of co-variance amongst items (item 2 and item 4) and therefore this model was adjusted and re-specified to reflect this co-variance. The addition of this error co-variance is justified due to the similarity in content between these two items (“I ask/answer questions in class”). The re-specified model improved the fit of this scale. To ensure that the hypothesised model had not been substantially changed, we computed the correlation between the initial and final factors scores (before and after this modification). Because the correlation between these two scores was found to be equal to .95, we were confident that the addition of these modification has not substantially changed the underlying structure of the scale (Ullman, 2013).
Create factor scores for inclusion in further analysis
Following the series of confirmatory factor analyses, factor scores were computed using the regression method (Gorsuch, 1983; Thompson, 2004) which provide composite (latent) scores of each individual’s placement on the factor and can be used for further statistical analyses (DiStefano, Zhu and Mindrilla, 2009). These scores are weighted depending on how the different items are contributing to the overall latent construct. Although scores may be computed simply by simply summing the raw scores computing factors scores, the regression method is believed to be more accurate and representative of the underlying latent construction, while the estimated scores that are provided are standardised scores that allow for the comparison among the scales (DiStefano et al., 2009). Once we had computed the regression scores, these standardised scores were transformed to t-scores (M =50, SD = 10). Summary statistics for each of the four scales are presented in Table 8 below while the distribution of the factor scores is presented visually in Appendix E for each scale.
| N | M | S.D. | Min | Max | Skewness | Kurtosis | |
|---|---|---|---|---|---|---|---|
| Social Skills | 3,084 | 49.92 | 2.64 | 38.85 | 52.42 | -1.15 | 4.15 |
| Student Effort | 3,084 | 49.98 | 1.96 | 41.09 | 51.60 | -1.39 | 4.81 |
| Family Support for Learning | 3,084 | 49.98 | 2.72 | 38.98 | 52.18 | -1.39 | 4.73 |
| Teacher-Student Relationship | 3,084 | 49.96 | 2.04 | 41.26 | 51.77 | -1.23 | 4.27 |
As we can see from the data presented, the final scores are highly negatively skewed (although not extreme)9 (Blanca et al., 2013). Depending on the future analysis undertaken. this might not be an issue if these scales are used as independent variables, but might require careful consideration if the scales are used as a dependent variables (Blanca et al., 2013: Tabachnick and Fidell, 2013).10
Including measures of aspects of students’ socio-emotional learning and social support of learning - in addition to student’s’ academic learning—can help to achieve a more expansive and holistic understanding of students’ learning outcomes. It helps to draw attention to the environment within which students are situated, and how this impacts their learning, and to consider processes of learning rather than just learning outcomes. Nevertheless, capturing these aspects of students learning—especially in the Global South—is not straightforward given that these constructs are largely unobservable and the measures that do exist have mostly been developed in the Global North. In this paper, we have outlined our emerging strategy for developing a set of culturally relevant scales that can successfully capture important aspects of students’ socio-emotional learning and social support for learning among grade four students in Ethiopia. As we have shown, measuring socio-emotional skills is not straightforward and there have been several challenges that we have faced during this process. Some of the challenges included the fact that we were required across multiple languages and cultural contexts, and the fact that we were somewhat limited in our scope since this work was carried out as part of a larger student on students’ learning and education quality. Some of the strengths of our approach have included the participation of multiple stakeholders and experts in the process, the rigorous process of translation that we undertook and the development of scales that show good psychometric properties. Some of these aspects may be important for researchers to consider when seeking to conduct similar research in related contexts. Importantly, we suggest that these scales can be used effectively in future analysis, which can potentially provide greater insight into students’ socio-emotional learning and development.
Adams, A. V. 2012. The role of skills development in overcoming social disadvantage. Background paper prepared for the education for all global monitoring report.
Appleton, J. J., Christenson, S. L., Kim, D., and Reschly, A. L. 2006. Measuring cognitive and psychological engagement: Validation of the Student Engagement Instrument. Journal of school psychology, 44(5), 427-445.
Bandura A. 1990. Multidimensional scales of perceived academic efficacy. Stanford, CA: Stanford University.
Benson, J., and Fleishman, J. A. 1994. The robustness of maximum likelihood and distribution-free estimators to non-normality in confirmatory factor analysis. Quality and Quantity, 28(2), 117-136.
Blanca, M. J., Arnau, J., López-Montiel, D., Bono, R., and Bendayan, R. 2013. Skewness and kurtosis in real data samples. Methodology.
Brunello, G. and Schlotter, M. 2010. The effect of non-cognitive skills and personality traits on labour market outcomes. Analytical report for the European Commission prepared by the European Expert Network on Economics of Education.
Caspi, A., Wright, B. R. E., Moffitt, T. E. and Silva, P. A. 1998. Early failure in the labor market: Childhood and adolescent predictors of unemployment in the transition to adulthood. American sociological review, 424-451.
Clark, L. A. and Watson, D. 2016. Constructing validity: Basic issues in objective scale development.
Crandall, V. C., Crandall, V. J. and Katkovsky, W. 1965. A children’s social desirability questionnaire. Journal of Consulting Psychology, 29(1), 27–36. https://doi.org/10.1037/h0020966
Danielson, C. K. and Phelps, C. R. 2003. The assessment of children’s social skills through self-report: A potential screening instrument for classroom use. Measurement and Evaluation in Counseling and Development, 35(4), 218-229.
Dercon, S. and Krishnan, P. 2009. Poverty and the socio-emotional competencies of children: evidence from the young lives sample in four developing countries. Children Youth and Environments, 19(2), 138-163.
DiStefano, C., Zhu, M. and Mindrila, D. 2009. Understanding and using factor scores: Considerations for the applied researcher. Practical Assessment, Research, and Evaluation, 14(1), 20.
Duckworth, A. L. and Yeager, D. S. 2015. Measurement matters: Assessing personal qualities other than cognitive ability for educational purposes. Educational Researcher, 44(4), 237-251.
Elias, M. J., Zins, J. E., Weissberg, R. P., Frey, K. S., Greenberg, M. T., Haynes, N. M. and Shriver, T. P. 1997. Promoting social and emotional learning: Guidelines for educators. Ascd.
Gorsuch, R. L. 1997. New procedure for extension analysis in exploratory factor analysis. Educational and Psychological Measurement, 57(5), 725-740.
Gutman, L. M. and Schoon, I. 2013. The impact of non-cognitive skills on outcomes for young people. Education Endowment Foundation, 59(22.2).
Heckman, J. 2007. Investing in disadvantaged young children is good economics and good public policy. Testimony before the Joint Economic Committee, Washington, DC, June, 27.
Hu, L. T. and Bentler, P. M. 1999. Cutoff criteria for fit indexes in covariance structure analysis: Conventional criteria versus new alternatives. Structural equation modeling: a multidisciplinary journal, 6(1), 1-55.
Huang, Y. and Bentler, P. M. 2015. Behaviour of asymptotically distribution free test statistics in covariance versus correlation structure analysis. Structural Equation Modelling: A Multidisciplinary Journal, 22(4), 489-503.
Kaiser, H. F. (1964). A method for determining eigenvalues. Journal of the Society for Industrial and Applied Mathematics, 12(1), 238-248.
Kim, U., Yang, K. S., and Hwang, K. K. (Eds.). (2006). Indigenous and cultural psychology: Understanding people in context. Springer Science and Business Media.
Little, A. W. and Azubuike, O. B. 2017. Young lives school surveys 2016–17: The development of Non-Cognitive instruments in Ethiopia, India and Vietnam.
Liu, W. C., Wang, C. K. J. and Parkins, E. J. 2005. A longitudinal study of students’ academic self‐concept in a streamed setting: The Singapore context. British Journal of Educational Psychology, 75(4), 567-586.
Tabachnick, B. G. and Fidell, L. S. 2013. Using multivariate statistics: International edition. Pearson2012.
Taber, K. S. 2018. The use of Cronbach’s alpha when developing and reporting research instruments in science education. Research in Science Education, 48(6), 1273-1296.
Thompson, B. 2004. Exploratory and confirmatory factor analysis. American Psychological Association.
Ullman, J. B. 2006. Reviewing the basics and moving forward. J Pers. Assess, 87, 35-50.
Liebenberg, L., Ungar, M. and LeBlanc, J. C. 2013. The CYRM-12: a brief measure of resilience. Canadian Journal of Public Health, 104(2), e131-e135.
Yorke, L. 2013. Validation of the Academic Stress Scale in The Vietnam School Survey Round.
Yorke, L. and Ogando, M. J. 2018. Socio-emotional scales in the Young Lives Round 4 Survey: Selection, adaptation and validation.
| Original Item | Suggested Adapted Item |
|---|---|
| 1. I look others in the face when they talk | 1. I feel confident talking to others |
| 2. Others like me and have fun with me | 2. Other people like me. |
| 3. I say thank you when someone does something nice for me | 3. I always say please and thank you |
| 4. I kick or hit someone else if they make me angry | 4. I avoid fighting with others |
| 5. I am bossy | Drop |
| 6. I take turns with others | Drop |
| 7. When I come over, others ask me to move or give them more space. | Drop |
| 8. I don’t play fairly | Drop |
| 9. I listen to others when they talk | Drop |
| 10. I share games and toys with others | 5. I like to share things with others. |
| 11. I say I’m sorry when I hurt someone by accident | Drop |
| 12. When I see others playing a game I would like to play, I ask if I can join them | Drop |
| Scale | Question | Appendix C: Distribution of Response for Socio-emotional Skills Scales |
|---|---|---|
| Social Skills | I feel confident talking to others | I am not ashamed with myself and I am able to communicate with others |
| I help others when they need help | If they see someone in difficulty they will try their best to help them. They understood this as not only material support but also helping others. | |
| Student Effort | I answer questions in class | This was about participating in class. |
| I try to learn from my mistakes | I ask my teacher questions when I get a question wrong in an exam. We try harder to do well in exams the next time. We try to improve our results. | |
| Family Support | Someone in my family helps me with my homework. | This was translated to “there is one person in my family who helps me with my homework”. The students were confused as to what they should answer if there was more than one person who helped them. Therefore this should be translated to “there is at least one person in my family who helps me with my homework”. |
| My family encourages me to learn | My family supports me and helps me to learn. They help me when I study. | |
| Teacher-Student Relationships | My teacher treats me the same as other students | My teacher treats all students the same. There are some teachers who do treat other students differently. They encourage the brilliant ones and not the other ones. |
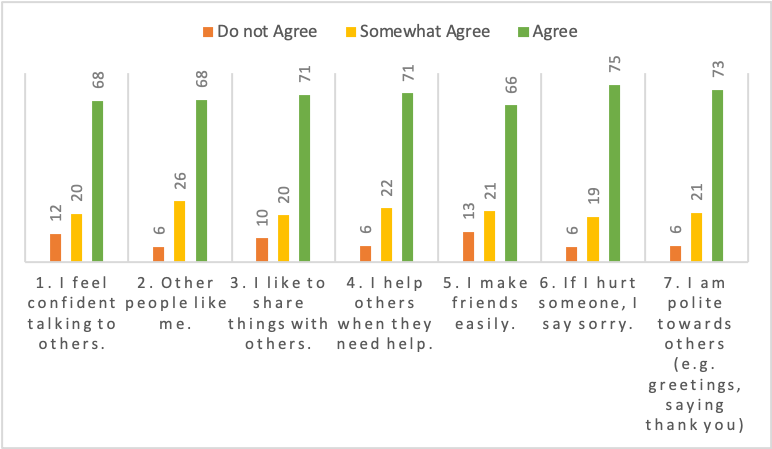
Distributions of responses for Social Skills scale (%)
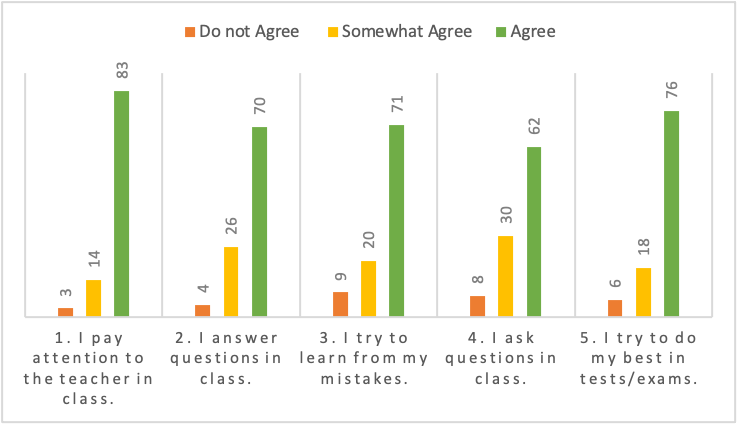
Distribution of responses for Student Effort scale (%)
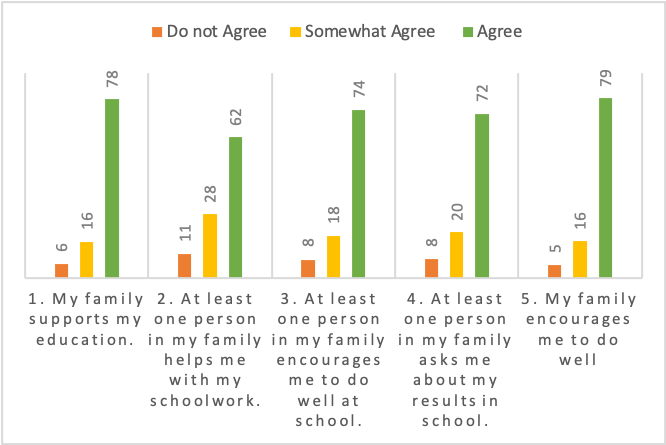
Distribution of responses for Family Support for Learning scale (%)
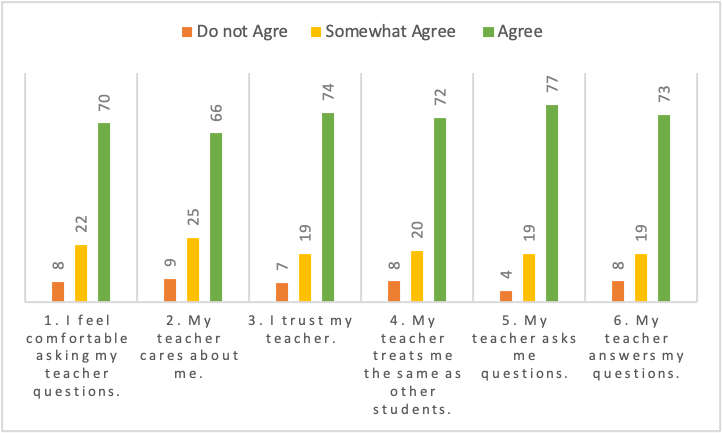
Distribution of responses for Student-Teacher Relationships scale (%)
| n | Do Not Agree (%) | Somewhat Agree (%) | Agree (%) | ||
|---|---|---|---|---|---|
| A. Student Effort | 1. I pay attention to the teacher in class. | 3.084 | 3.08 | 13.55 | 83.37 |
| 2. I answer questions in class. | 3.084 | 4.25 | 25.91 | 69.84 | |
| 3. I try to learn from my mistakes. | 3.084 | 8.95 | 20.46 | 70.57 | |
| 4. I ask questions in class. | 3.084 | 7.75 | 29.73 | 62.52 | |
| 5. I try to do my best in tests/exams. | 3.084 | 6.36 | 17.87 | 75.78 | |
| B. Family Support for Learning | 1. My family supports my education | 3.084 | 6.06 | 15.73 | 78.21 |
| 2. At least one person in my family helps me with my schoolwork | 3.084 | 10.51 | 27.845 | 61.64 | |
| 3. At least one person in my family encourages me to do well at school | 3.084 | 7.85 | 18.45 | 73.70 | |
| 4. At least one person in my family asks me about my results in school | 3.084 | 8.14 | 19.81 | 72.05 | |
| 5. My family encourages me to do well | 3.084 | 5.38 | 15.95 | 78.66 | |
| C. Teacher-Student Relationships | 1. I feel comfortable asking my teacher questions | 3.084 | 7.65 | 22.31 | 70.04 |
| 2. My teacher cares about me. | 3.084 | 8.85 | 25.10 | 66.05 | |
| 3. I trust my teacher. | 3.084 | 7.30 | 18.55 | 74.16 | |
| 4. My teacher treats me the same as other students. | 3.084 | 7.85 | 19.81 | 72.34 | |
| 5. My teacher asks me questions. | 3.084 | 4.15 | 18.74 | 77.11 | |
| 6. My teacher answers my questions | 3.084 | 7.94 | 18.84 | 73.22 | |
| D. Social Skills | 1. I feel confident talking to others. | 3.084 | 11.90 | 20.14 | 67.96 |
| 2. Other people like me. | 3.084 | 6.03 | 25.49 | 68.48 | |
| 3. I like to share things with others. | 3.084 | 9.89 | 19.58 | 70.53 | |
| 4. I help others when they need help. | 3.084 | 6.39 | 22.47 | 71.14 | |
| 5. I make friends easily. | 3.084 | 12.65 | 21.27 | 66.08 | |
| 6. If I hurt someone, I say sorry. | 3.084 | 6.00 | 19.07 | 74.94 | |
| 7. I am polite towards others (e.g., greetings, saying thank you) | 3.084 | 6.45 | 20.69 | 72.86 |
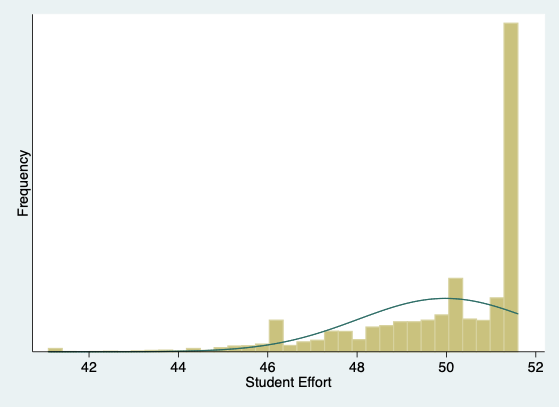
Student Effort Factor score (t-score)
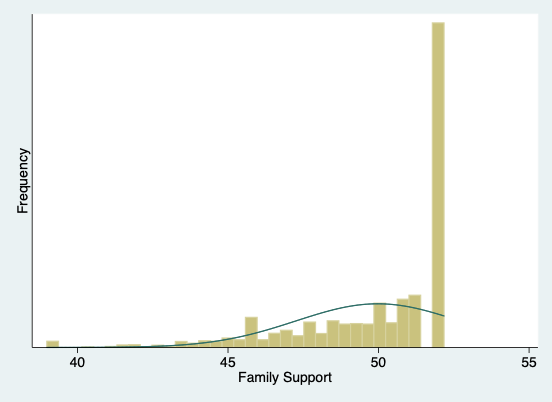
Family Support Factor score (t-score)
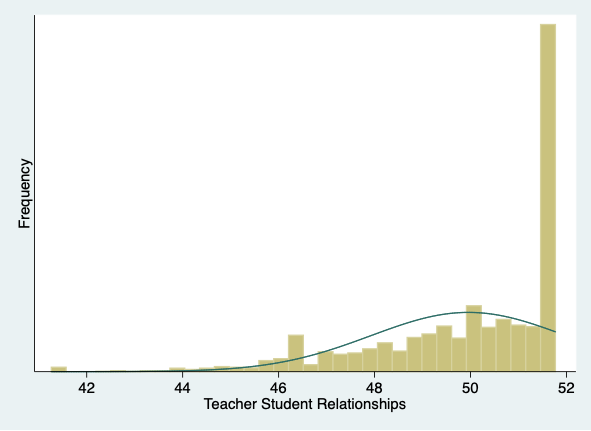
Teacher-Student Relationships Factor score (t-score)
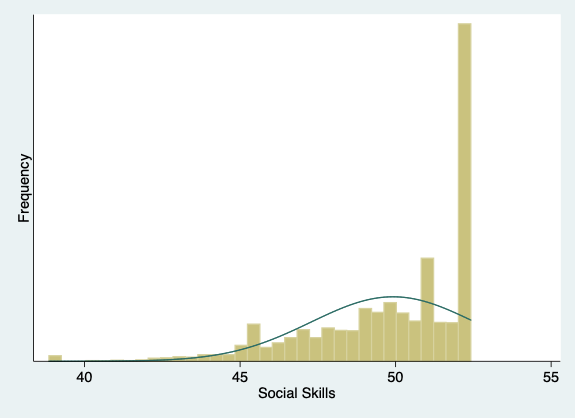
Social Skills Factor score (t-score)
Louise Yorke is a researcher on the RISE Ethiopia team. She is a Research Associate at the Research for Equitable Access and Learning (REAL) Centre at the Faculty of Education, University of Cambridge. She has a BA (University College Dublin) and MSc in Psychology (Trinity College Dublin). She recently completed her PhD at the School of Social Work and Social Policy Trinity College Dublin, which focused on the lives, experiences and choices of rural girls as they negotiate different pathways to urban secondary schools in Ethiopia. Her research interests involve the use of quantitative qualitative and participatory research methods to understand educational access and equity, social and cultural factors influencing the educational experiences and trajectories of girls and young women, and school-to-work transitions.
Darge Wole is a researcher on the RISE Ethiopia team. He is a Professor of Educational Psychology at Addis Ababa University (AAU). He has over forty years of teaching experience in the areas of educational psychology, social and cultural foundations of education, educational measurement, and other psychology/education courses. He has previously held the positions of Assistant Dean of the Education Faculty, Assistant Dean of the College of Social Sciences, Director of the Institute of Educational Research and Director of the Addis Ababa University Press at Addis Ababa University. He was also Deputy Permanent Delegate of Ethiopia to UNESCO (in Paris) from 2006 to 2011 and the author of a variety of articles and book chapters that focus on problems of primary and secondary school students and teachers. He is currently working on an introductory book in psychology for Ethiopian university students and is the chair or member of various advisory and editorial boards of publications at AAU; a member of the Ethiopian Academy of Sciences; a consultant in educational problems; and a trainer and resource person in professional development skills for university instructors.
Pauline Rose is the International Research Team Lead on the RISE Ethiopia team. She joined the University of Cambridge in February 2014 as Professor of International Education, where she is the Director of the Research for Equitable Access and Learning (REAL) Centre in the Faculty of Education. Prior to joining Cambridge, she was Director of the Education for All Global Monitoring Report and directed two reports on youth, skills and work; and on teaching and learning. She is author of numerous publications on issues that examine educational policy and practice, including in relation to inequality, financing and governance and the role of international aid. She has worked on large collaborative research programmes with teams in sub-Saharan Africa and South Asia examining these issues. Throughout her career, she has worked closely with international aid donors and non-governmental organisations,
Yorke, L., Wole, D. and Rose, P. 2021. An Emerging Strategy for the Development of Culturally Relevant Scales to Capture Aspects of Students’ Socio-Emotional Learning and Social Support for Learning. 2021/031. https://doi.org/10.35489/BSG-RISE-RI_2021/031