Dawit Tibebu Tiruneh
Research for Equitable Access and Learning (REAL) Centre, University of Cambridge
Insight Note

Research for Equitable Access and Learning (REAL) Centre, University of Cambridge

Research for Equitable Access and Learning (REAL) Centre, University of Cambridge

The Ethiopian government has shown a great deal of commitment since 2008 to improving access to quality general education for all with its investment on the General Education Quality Improvement Program (GEQIP) (Asgedom et al., 2019; World Bank, 2017). The GEQIP in general has been aiming to improve teaching and learning conditions in primary education, and to strengthen educational institutions and service delivery at federal and regional levels (World Bank, 2008). The first phase of this programme, GEQIP-I (2008-2013) focused on providing essential inputs for improving teaching and learning, and the second phase, GEQIP-II (2013-2018), continued the focus on resource provision and improvement activities of GEQIP-I and incorporated information and communication technology as an additional component (Hoddinott et al., 2019; World Bank 2012). The third and current phase of the programme is GEQIP-E (2018-2022). Building on the strengths and challenges of GEQIP-I and GEQIP-II, the current GEQIP-E programme aims to improve the quality of general education with an explicit focus on equity (World Bank, 2017). Equity in education refers to providing all children with the opportunity to reach their full potential and achieve at least a basic level of good quality education, regardless of their gender, family background, or disability status.
As a result of the various reform efforts, there has been a remarkable increase in primary school enrolment in Ethiopia over the past two decades, from 7.1 million learners in 2000 to nearly 21 million in 2017 (Ministry of Education, 2017). However, equitable access to quality primary education for all children remains a concern in Ethiopia (see, Iyer & Rossiter, 2018; World Bank, 2017). Despite the considerable focus given to equity in the Education and Training Policy (Ministry of Education, 1994), and subsequently, on several Education Sector Development Plans (ESDPs), the primary education system in Ethiopia has not yet managed to reach the most disadvantaged children, many of whom remain out of school (see, Yorke et al., 2021). Children who are the most disadvantaged in Ethiopia include girls, children with disabilities, and children living in the “emerging regions” of Afar, Benishangul-Gumuz (Be-Gu) and Somali where support for education has historically been limited (World Bank, 2017).
In synergy with the education Sustainable Development Goal that aims to ensure inclusive and equitable quality education for all by 2030 with target 4.1 focusing on access and learning for all (UN General Assembly, 2015), a key results area of the current GEQIP-E programme is improving equitable access to learning for all with a particular focus on girls, children with disabilities, and children living in the emerging regions (Asgedom et al., 2019; World Bank, 2017). The equitable access results area emphasises three specific goals: (a) improve gender parity at the upper-primary level in Afar, Somali, and Be-Gu; (b) improve Gross Enrolment Ratio (GER) of children in Grades 1-8 in Afar, Somali, and Be-Gu; and (c) improve primary school participation of children with special educational needs nationally (World Bank, 2017). To achieve the aforementioned goals, several interventions were designed and have been implemented since the 2018/19 academic year. Regarding gender parity at the upper-primary level in the emerging regions, for example, interventions such as empowerment of girls through girls’ clubs, provision of life-skills training for girls, additional educational resources for the schools, design of gender-sensitive school improvement planning, and establishment of safer school environments for girls were designed and implemented in schools in the emerging regions. Regarding enrolment of children with disabilities, interventions such as establishing inclusive education resource centres (IERCs) and increasing the number of teachers trained on special needs education were designed and implemented in all the schools nationally (World Bank, 2017).
Given that promoting equitable access to quality primary education for all is a key broad goal of the current GEQIP-E reform, it is essential to investigate towards the end of the programme whether those sets of interventions that were designed and implemented in the schools were effective in achieving the targeted goal. To do so, a study that provides some baseline evidence on the various indicators of inequity that could serve in tracking the impact of GEQIP-E on equitable access is necessary. An important research goal of RISE (Research on Improving Systems of Education) Ethiopia, a five-year research programme funded by the UK’s Foreign, Commonwealth and Development Office; Australia’s Department of Foreign Affairs and Trade; and the Bill and Melinda Gates Foundation, is to understand whether the GEQIP-E reforms improve equitable access to primary education (Asgedom et al., 2019; Hoddinott et al., 2019). Drawing on an initial analysis of the first round of the RISE Ethiopia school survey, this Insight aims to provide an overview of the prevalence of inequity in access to primary education for children living in the emerging regions and children with disabilities at the national level. The findings from this study are expected to provide some foundation to understand whether the GEQIP-E reform is on track to meeting the above-mentioned equity-related goals.
RISE Ethiopia adopts a longitudinal design to understand the impact of GEQIP-E on learning outcomes and equitable access to primary education in Ethiopia.1 The longitudinal design involves collecting data from two cohorts of children at four points in time: at the beginning and the end of the 2018/19 academic year; and at the beginning and the end of the 2021/22 academic year. The baseline data presented in this Insight represent some of the data collected at the beginning of the 2018/19 academic year from Grade 1 and Grade 4 children and school principals. Primary schools in seven regions that are intended to represent all of the regions in Ethiopia were targeted. Table 1 presents an overview of the sample across regions and grade levels by gender. Twenty schools were selected in Addis Ababa representing the urban centre. Twenty-five schools in Amhara, 41 schools in Oromia, 22 schools in Southern Nations Nationalities and People’s Region (SNNP) and 20 schools in Tigray were selected representing the “central” regions. Nineteen schools each in Be-Gu and Somali regions were selected to represent the “emerging” regions. The schools selected in each region were assumed to reflect the characteristics of all schools in that particular region. Across the regions, 4,121 Grade 1 and 4,137 Grade 4 students participated at the baseline school survey (see, Hoddinott et al., 2019, for a detailed description of the sampling and identification strategies of the RISE Ethiopia school survey).
Table 1. Distribution of the overall sample by region, grade, and gender
| Category | Region | Number of Schools | Total Number of ChildrenA | Total | |||||
|---|---|---|---|---|---|---|---|---|---|
| Grade 1 | Grade 4 | ||||||||
| Male | Female | Total | Male | Female | Total | ||||
| Central | Amhara | 25 | 321 | 321 | 642 | 323 | 304 | 627 | 1269 |
| Oromia | 41 | 514 | 525 | 1039 | 565 | 517 | 1082 | 2121 | |
| SNNP | 22 | 272 | 266 | 538 | 282 | 286 | 568 | 1106 | |
| Tigray | 20 | 254 | 260 | 514 | 262 | 260 | 522 | 1036 | |
| Emerging | Be-Gu | 19 | 236 | 232 | 468 | 244 | 224 | 468 | 936 |
| Somali | 19 | 197 | 192 | 389 | 178 | 162 | 340 | 729 | |
| Urban | Addis Ababa | 20 | 264 | 267 | 531 | 277 | 253 | 530 | 1061 |
| Total | 166 | 2058 | 2063 | 4121 | 2131 | 2006 | 4137 | 8258 |
Note: AThe numbers indicate those students who completed the baseline tests and traced in the household survey.
A principal questionnaire, numeracy and literacy achievement tests, and household questionnaire were among the instruments administered at the baseline. The principal questionnaire was administered to all school principals in the 166 schools. Data about the language of instruction in the school, educational resources, teacher employment, parent-teacher association, boys-girls’ enrolment and learning, and enrolment and learning of children with disabilities were collected using the principal questionnaire. The tests were aimed at measuring numeracy and literacy competencies of both the Grade 1 and Grade 4 sample. The household questionnaire included a large number of items designed to understand the possible confounding effects of parental background characteristics on children’s numeracy and literacy learning outcomes.
For the purpose of this Insight, we focus on the principal, achievement test, and household data that are related to the equitable learning results area including learning outcome differences, girls’ and boys’ enrolment in the different grade levels, schools’ access to educational resources, availability of girls’ clubs, availability and on-time delivery of school grants, and enrolment and learning of children with disabilities. To examine the learning outcome differences between children living in the emerging regions and the urban centres, we focused on the numeracy test outcomes of the Grade 4 sample only.2
This section presents the findings mainly by comparing Be-Gu and Somali (representing the emerging regions) with either Addis Ababa, Amhara, SNNP, or Tigray (representing either the urban or relatively advanced regions). First, we present Grade 4 numeracy achievement, in terms of percentage of correct responses, across regions, between male
and female students, and between students in urban and rural localities. Second, given their importance to GEQIP-E reform, our findings focus on some indicators including girls to boys’ enrolment ratio, provision of facilities and access to educational resources in schools between emerging and relatively advanced regions. Third, access to primary education for children with disabilities and their numeracy learning outcomes are presented. The findings related to access for children with disabilities are discussed focusing on all the sample regions at the national level.
As shown in Table 2, the average numeracy score across the sample was 45.9. A one-way Analysis of Variance (ANOVA) indicated a statistically significant difference in numeracy scores between regions, F(6, 4130) = 103.5, p<0.001. A Bonferroni post hoc test indicated that students in Addis Ababa significantly outperformed students in all the other regions (p<0.001). Besides, those in Addis Ababa, Amhara, and Tigray (the relatively advanced regions) scored significantly higher than their counterparts in Be-Gu and Somali (p<0.001).
An independent sample t-test also revealed gender differences in numeracy scores. As indicated in Table 2, the score for boys across the sample (47.5) is significantly higher than the girls (44.1), t(4135) = 5.7, p<0.001. In Addis Ababa, however, girls significantly outperformed boys. In all the other regions, except in Be-Gu (p=0.53), boys significantly outperformed girls.
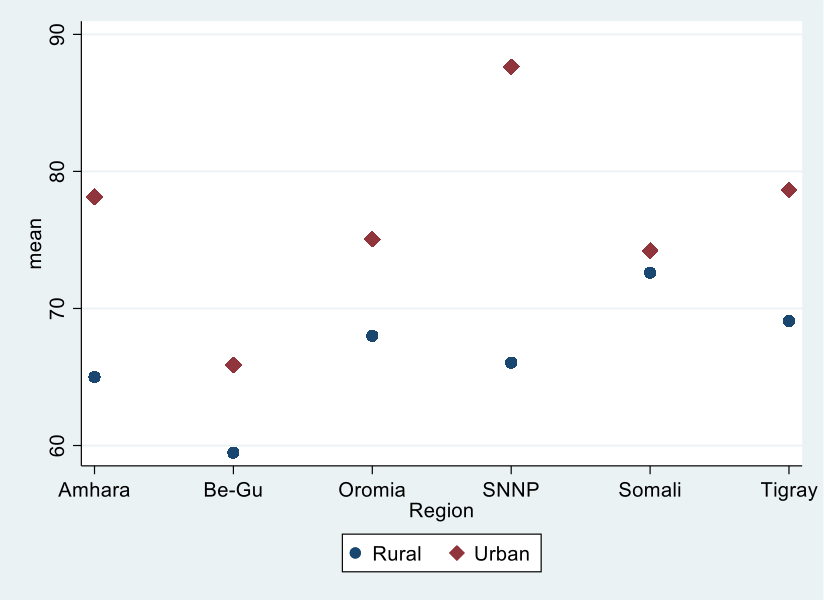
Moreover, across the sample, students in the urban locality (54.3) scored significantly higher than their rural counterparts (41.8%), t(4135)=20.4, p<0.001. Even after we exclude Addis Ababa (as it has only urban schools), the urban-rural numeracy achievement gap is statistically significant, t(3605)=10.4, p<0.001 (see Figure 1). Overall, girls in urban schools (54.3) scored significantly higher than girls in rural schools (39.1), t(2004)=18.4, p<0.001. Boys in urban schools (54.3) also scored significantly higher than their rural counterparts (44.3), t(2129)=11.3, p<0.001.
Table 2. Grade 4 numeracy scores, percentage correct, by region, gender, and locality
| Overall | Rural | Urban | ||||||||||||
| Region | Girl | Boy | Diff | Total | Girl | Boy | Diff | Total | Girl | Boy | Diff | Total | ||
| Addis Ababa | 63.7 | 60.2 |
-3.5** (2.5) |
61.9 | -- | -- | -- | -- | 63.7 | 60.2 | -3.5 | 61.9 | ||
| Amhara | 45.0 | 51.3 |
6.4*** (4.1) |
48.2 | 43.4 | 50.5 | 7.1 | 47.0 | 49.3 | 53.7 | 4.5 | 51.6 | ||
| Be-Gu | 37.2 | 38.2 | 1.0 | 37.7 | 35.1 | 36.1 | 1.0 | 35.6 | 46.7 | 52.0 | 5.3 | 49.1 | ||
| Oromia | 39.3 | 46.1 |
6.8** (6.0) |
42.9 | 37.7 | 45.4 | 7.7 | 41.8 | 45.3 | 49.4 | 4.1 | 47.3 | ||
| SNNP | 39.9 | 42.2 |
2.4* (1.7) |
41.0 | 38.2 | 40.9 | 2.6 | 39.6 | 46.7 | 48.4 | 1.7 | 47.5 | ||
| Somali | 40.3 | 43.0 |
2.7* (1.7) |
41.7 | 39.2 | 44.5 | 5.3 | 42.0 | 43.4 | 39.0 | -4.3 | 41.0 | ||
| Tigray | 46.7 | 49.7 |
3.0* (1.8) |
48.2 | 42.1 | 47.4 | 5.3 | 44.7 | 56.9 | 54.7 | -2.2 | 55.8 | ||
| Total | 44.1 | 47.5 |
3.4*** (5.7) |
45.9 | 39.1 | 44.3 | 5.2 | 41.8 | 54.3 | 54.3 | -0.1 | 54.3 |
Notes: t-test of the difference in mean scores between boys and girls is significant at ***p<0.001; **p<0.05; *p<0.1; t-statistics in parentheses.
Moreover, the findings revealed that girls in rural schools scored significantly lower than boys in the same rural schools, and girls in rural schools scored significantly lower than both girls and boys in urban schools. These findings in achievement differences between boys and girls, and between students in urban and rural schools are in line with previous evidence that being a girl and from a disadvantaged area is a double disadvantage for girls (e.g., Yorke et al., 2019). This finding suggests that girls in economically disadvantaged regions such as Somali probably do not get the required support in the instructional process even when they manage to attend school.
The principals of all the sample schools were asked to report the total number of girls and boys enrolled in all of the grade levels in the 2018/19 academic year. We found that girls to boys’ enrolment ratio in Grade 8 in the emerging regions (e.g., Somali) is much lower than the relatively more advanced regions (e.g., Amhara and Tigray). Although our data were collected from a small proportion of the overall school population in each region, the Grade 8 girls to boys’ enrolment ratio in 2018/19 academic year in Somali was 0.74, whereas it was 1.05 in Amhara and 1.24 in Tigray regions. The gap on the girls to boys’ enrolment ratio increases in Somali as grade level increases. The girls to boys’ enrolment ratio in Grade 1 for the 2018/19 academic year in Somali was 1.30. This ratio gets lower as the grade level moves up, where it becomes 0.97 in Grade 4, and 0.74 in Grade 8. It appears that the dropout rate for girls in Somali increases as the grade level increases.
Our data is in line with the government figures in the 2016/17 Annual Education Statistics Abstract (Ministry of Education, 2017). For example, girls’ GER in upper-primary education in Addis Ababa in 2016/17 was 144.6 percent, while it was only 29 percent in Afar and 41.7 percent in Somali. This inequitable access to upper-primary education for children in emerging regions is particularly prevalent in Grade 8. The national GER for Grade 8 is 51 percent for girls and 49 percent for boys. However, in Somali, the Grade 8 GER for girls is only 21 perccent and for boys 26 percent, and 19 percent for girls and 27 percent for boys in Afar (Ministry of Education, 2017). It is possible to see from the above figures that Grade 8 GER in Somali is much lower than the national average even in the 2018/19 academic year. Moreover, girls’ enrolment in Somali is much lower compared to boys within the same region.
Ethiopia’s Education and Training Policy (Ministry of Education, 1994) outlines strategies to improve girls’ enrolment in primary education, such as ensuring the curriculum is sensitive to gender issues, providing educational inputs for girls, and providing financial support to raise the participation of women in education. The subsequent Education Sector Development Plans have also provided a huge emphasis on improving girls’ enrolment in Ethiopia. At the national level, there is an increasing trend of primary GER for girls. For example, the lower-primary education GER increased from about 70 percent in 2000/01 to about 132 percent in 2016/17, and the upper-primary education from about 23 percent in 2000/01 to about 71 percent in 2016/17 (Ministry of Education, 2017). However, emerging regions including Afar and Somali lag significantly behind other relatively more advanced regions in Ethiopia on girls’ access to upper-primary education. The issue of dropout for girls in the emerging regions is widespread at the upper-primary level due to early marriage and social roles (World Bank, 2017).
Given that girls’ access to primary education in the emerging regions are constrained by several factors such as early marriage, high demand for girls’ labour at home, and gender-based violence, several strategies have been designed and implemented in Ethiopia over the past 15 years to improve girls’ access to upper-primary education, and particularly to reduce grade repetition and dropout rates (Ministry of Education, 2015; Yorke et al., 2019). Establishing vibrant girls’
clubs in schools that would empower girls and providing adequate facilities such as separate latrines are among the strategies that have been in place for a few years now to encourage girls in emerging regions to continue their education.
As part of the RISE Ethiopia baseline assessment, school principals were asked to provide gender related information including some of the main causes of girls’ dropout: availability of facilities for girls in the school including girls’ clubs and provision of separate latrines for girls and boys. On the main causes of girls’ dropout, we found that early marriage is still mentioned as the main factor for high girls’ dropout in 9 (47%) out of the 19 schools in Somali. By contrast, early marriage was not referred to as a cause of girls’ dropout in Addis Ababa. On availability of girls’ clubs, it was found that all 20 schools in Addis Ababa have established girls’ clubs. Similar to Addis Ababa, schools in Be-Gu appear to be doing well in terms of establishing girls’ clubs. Out of the 19 sample schools, 17 (90%) schools reported having established girls’ clubs. However, schools in Somali appear to lag behind other schools in Be-Gu and Addis Ababa with regard to establishing girls’ clubs: only 12 (63%) out of the 19 schools reported to have established girls’ clubs in Somali (see Figure 2).
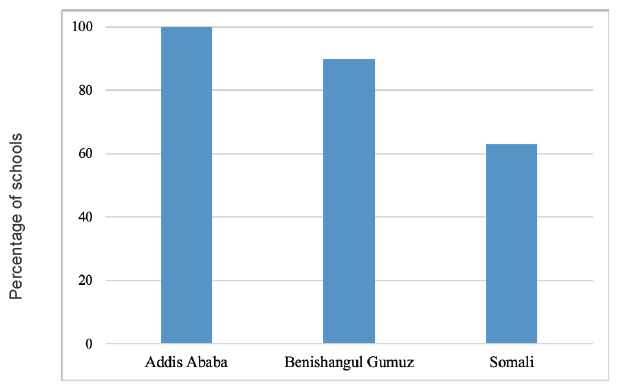
Note: Number of schools without girls’ clubs in Addis Ababa = 0 (total number of schools = 20); in Benishangul-Gumuz = 2 (total number of schools =19); and in Somali=7 (total number of schools =19).
More than 60 percent of the schools either in Addis Ababa or Be-Gu reported organising girls’ club activities at least once per month or more. However, among the 12 schools in Somali that reported to have established girls’ clubs, only 5 (40%) schools organise girls’ club activities at least once per month or more. The remaining 7 (60%) schools reported having organised girls’ club activities only 3 to 4 times per year. This is worrisome because establishing girls’ clubs in schools by itself is not an assurance that girls will benefit unless relevant activities that would empower girls are organised as frequently as possible. It is encouraging, however, that nearly 70 percent of the schools in Somali that reported to have established girls’ clubs do provide life skills training for girls, provide information about sexual and reproductive health, and provide sanitary pads for girls.
Regarding the provision of adequate facilities for girls, school principals were asked to report the availability of separate latrines for boys and girls. Having a separate latrine is a significant constraint to girls continuing their education especially when they reach puberty. All 20 (100%) schools in Addis Ababa and 18 (95%) schools in Be-Gu reported that separate latrines for male and female students are available. In Somali, 16 (84%) schools reported having separate latrines for boys and girls. It is necessary to point out here that although schools in emerging regions provide separate latrines, the facilities in those latrines are very minimal. In Somali, for example, none of the 16 schools that reported to have separate latrines provides separate places for girls to wash out menstrual rags. While we acknowledge that our sample size is very restricted, the finding that none of the schools in Somali provides separate places for girls to wash out menstrual rags is alarming. Moreover, out of the 18 schools in Be-Gu that reported to have separate latrines for girls and boys, only 14 (78%) schools have separate places for girls to wash out menstrual rags.
It is usually the case that disadvantaged learners from resource-challenged schools receive poor quality instruction (OECD, 2012). To understand schools’ access to educational resources and funding, the principals of all 166 schools were asked questions related to the availability of different school resources that are assumed to be useful to encourage student enrolment and learning. Availability of a functional pedagogical centre (a room in which teaching and learning materials are prepared, stored, and shared), student-textbook ratio, and on-time receipt of school grants were among the questions asked.
There appears to be a wide variation between Addis Ababa and emerging regions on the distribution of educational resources. On the availability of a functional pedagogical centre, we found all 20 (100%) schools in Addis Ababa have access to a functional pedagogical centre. However, it is only 9 (47%) schools in Be-Gu and 6 (32%) schools in Somali that reported to have access to a functional pedagogical centre (see Figure 3).
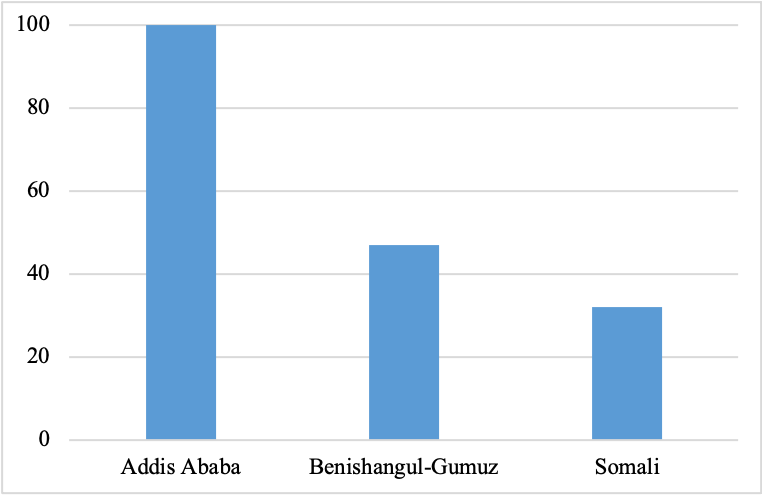
Note: Number of schools without access to a functional pedagogical resource centre in Addis Ababa = 0 (total number of schools = 20); in Benishangul-Gumuz = 10 (total number of schools =19); in Somali = 13 (total number of schools =19).
On student-textbook ratio, all 20 principals in Addis Ababa reported having achieved a 1:1 student-textbook ratio in their schools. However, only 4 (21%) schools in Be-Gu and 11 (58%) schools in Somali reported having achieved a 1:1 student-textbook ratio. The remaining 14 (74%) schools in Be-Gu and 7 (37%) schools in Somali reported the student-textbook ratio as either 1:2 or above (see Figure 4).
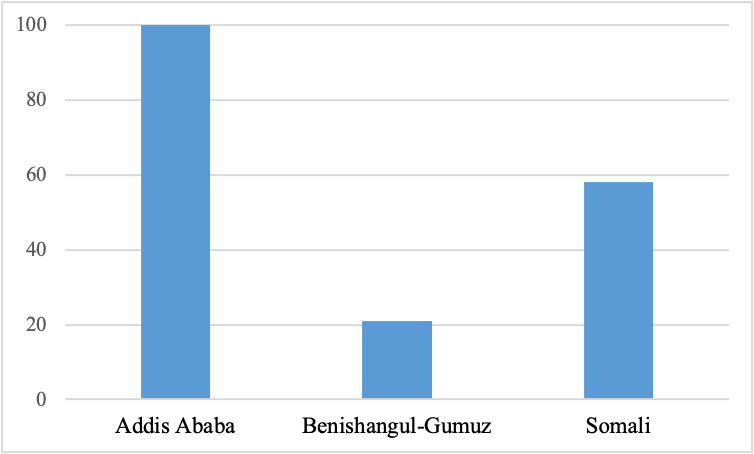
Note: Number of schools that did not achieve one textbook per student in Addis Ababa = 0 (total number of schools = 20); in Benishangul-Gumuz =15 (total number of schools =19); in Somali = 8 (total number of schools =19).
Data were also collected on whether the schools received school grants on time in the 2017/18 academic year and the principals’ views on the adequacy of the funds received from the school grant to meet all of the needs for which the grant was intended. Again, although we acknowledge that our school sample size in each region was limited, it appears that a significant majority of schools in emerging regions did not receive the school grant on time. Somali region appears to lag significantly behind Addis Ababa in terms of on-time receipt of the grant as only 5 (26%) schools reported to have received the school grant on time, but 11 (58%) schools in Addis Ababa did. It is also important to point out here that from all 166 school principals included in the sample, 91 (55%) principals indicated that the school grant was not sufficient to meet the school needs for which the grant was intended. Only 13 (8%) principals indicated that the school grant was enough to meet all of the needs for which the grant was intended.
Although we are not inferring any cause-effect relationship, there appears to be a relationship between access to educational resources and numeracy competence for Grade 1 and Grade 4 children both in the emerging regions and Addis Ababa. Grade 1 numeracy competence for children in Addis Ababa (85.88) is significantly higher than those in Be-Gu (59.97) and Somali (72.66). Additionally, Grade 4 children numeracy competence in Addis Ababa (62.05) is significantly higher than Be-Gu (38.57) and Somali (42.02). The difference in numeracy competence between children learning in the schools in Addis Ababa and emerging regions appear to widen as grade level increases from Grade 1 to Grade 4.
There is evidence that children with disabilities face far greater barriers than other children in terms of access to primary education (Rose and Alcott, 2015). The baseline data looked into some information on whether the School Improvement Plan (SIP) includes
a disability-friendly school environment, whether the schools provide teaching-learning materials specifically designed for students with disabilities, the procedures followed by the schools to identify children with disabilities, the way children with disabilities are taught in the schools, and whether teachers in the schools received training on providing education for children with disabilities.
As shown in Table 3, there is a wide variation across schools in the various regions on the afore-mentioned activities for children with disabilities. On the question of whether the SIP includes a disability-friendly school environment, for example, we found that more than half of the schools in our sample reported that their SIP includes provisions for a disability-friendly school environment. Addis Ababa (80%), Amhara (80%), and Tigray (70%) from the relatively advanced regions, and Be-Gu (83%) from the emerging regions appear to do well in this respect. However, only half of the schools in Oromia (51%) and Somali (53%) reported having included in their SIP a disability-friendly school environment.
We also found that only a small percentage of schools in the regions provide teaching and learning materials that are specifically designed for students with disabilities. It is only in Addis Ababa that we found just over half of the sample schools (55%) providing learning materials specifically designed for students with disabilities, and only 7 percent of the schools in both Be-Gu and Oromia. It is interesting to note that Amhara and Tigray were among the regions that reported to have included a disability-friendly school environment in their SIPs. However, on the provision of learning materials specifically designed for children with disabilities, a basic first step to support children with disabilities, both Amhara (28%) and Tigray (20%) are lagging behind. Lack of financial resources (33%) is mentioned by the school principals across the seven regions as the main reason for not providing teaching-learning materials specifically designed for children with disabilities.
Table 3. Access to quality primary education for children with disabilities
| Question to the principal | Regions | |||||||
|---|---|---|---|---|---|---|---|---|
| Addis Ababa | Amhara | Oromia | SNNP | Tigray | Be-Gu | Somali | Total | |
| % Yes | % Yes | % Yes | % Yes | % Yes | % Yes | % Yes | % Yes | |
|
1. Does the School Improvement Plan include a disability-friendly school environment? |
80 | 80 | 51 | 64 | 70 | 84 | 53 | 69 |
|
2. Does the school provide teaching and learning materials specifically designed for students with disabilities? |
55 | 28 | 7 | 41 | 20 | 7 | 37 | 28 |
|
3. How are children with disabilities identified at this school? |
||||||||
|
Trained teacher or staff member by using officially approved guidelines |
40 | 8 | 12 | 8 | 0 | 32 | 5 | 15 |
|
Untrained teacher or staff member, but by using officially approved guidelines |
0 | 20 | 12 | 0 | 5 | 16 | 0 | 53 |
|
Trained teacher or staff member without the use of officially approved guidelines |
45 | 12 | 5 | 13 | 15 | 32 | 26 | 21 |
|
Any teacher or member of staff |
0 | 0 | 21 | 29 | 40 | 16 | 11 | 17 |
|
4. How are students with disabilities taught in this school? |
||||||||
|
Integrated into mainstream classrooms |
75 | 12 | 47 | 56 | 60 | 95 | 16 | 52 |
|
In mainstream classrooms, but taught separately |
0 | 8 | 0 | 0 | 0 | 5 | 5 | 3 |
|
In separate classrooms |
5 | 16 | 2 | 14 | 0 | 0 | 0 | 5 |
|
A combination of the above |
5 | 16 | 2 | 14 | 0 | 0 | 0 | 5 |
|
5. Do teachers in the school received training on providing education for children with disabilities? |
80 | 40 | 26 | 36 | 35 | 32 | 32 | 40 |
Note: Total number of schools in Addis Ababa=20; in Amhara=25; in Oromia=41; in SNNP=22; in Tigray=20; in Be-Gu=19; in Somali=19.
Regarding the question on how schools identify children with disabilities, 31 (18%) schools reported that teachers or staff members without the required training identify children with disabilities and 67 (40%) schools did not answer the question on how they identify children with disabilities. This suggests that many primary schools in Ethiopia have not probably established a reliable approach to identify children with disabilities. Although some schools reported that they teach children with disabilities by integrating them into the mainstream classrooms, it is evident from the data that most of the teachers did not get sufficient training on the provision of education for children with disabilities. Except for the schools in Addis Ababa, more than 50 percent of the school principals in the remaining regions reported that the teachers did not receive the required training on the provision of education for children with disabilities. Although we are aware that our sample is not representative of the primary school student population in Ethiopia, our findings suggest that the great majority of Ethiopian children with disabilities are taught by teachers who are probably less prepared to help them acquire the skills they need for successful completion of their education and move into adult life.
By using questions adopted from the Washington Group on Disability Statistics,4 the RISE Ethiopia baseline assessment collected data from parents or primary caregivers of the targeted children on disability, focusing particularly on the Child Functioning Questions (CFQs) for children aged 5 to 17 years. The Washington Group uses the World Health Organisation’s (WHO) conceptual framework of disability as a bio-psycho-social model of human functioning. In this regard, disability is understood from the interaction between children with impairments and attitudinal and environmental barriers that hinder their full and effective participation in the society and the education system (Rose et al., 2018).
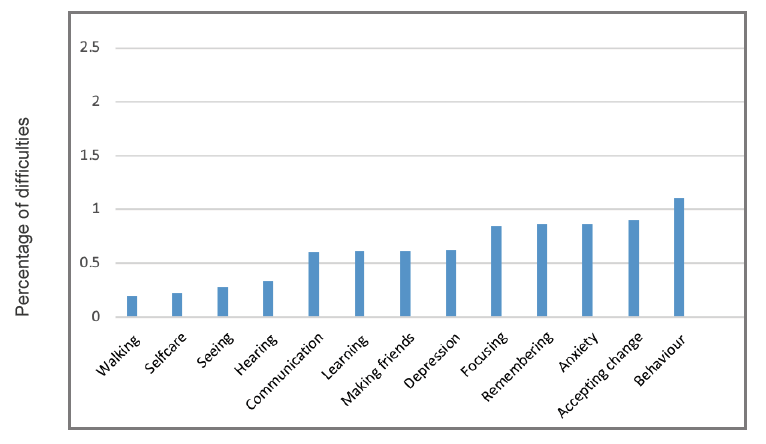
The CFQ identifies 13 areas of function including seeing, hearing, walking, self-care, remembering, communicating with others, learning, behaviour, accepting change, concentrating or focusing, making friends, anxiety, and depression. Nearly 21 percent of the total sample children were reported to having either a mild (17%) or a moderate to severe (4%) disability, while the remaining children (79%) reported to having no disabilities at all. The highest reported difficulty in our sample was ‘behaviour’, with 1.1 percent of the children having moderate to severe difficulty of controlling behaviour. The lowest reported difficulty was ‘walking’, in which only 0.2 percent of the sample children reported to having moderate to severe walking difficulty. Figure 5 provides the distribution of difficulties by type of difficulty among children with only reported moderate to severe difficulties.
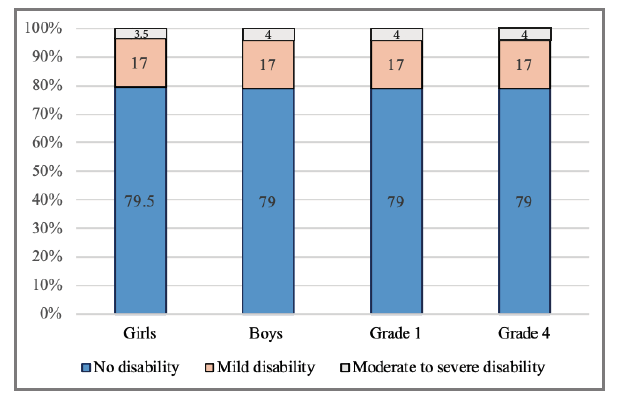
We estimated the prevalence of disability for girls and boys, and for Grade 1 and Grade 4 children as measured through functional difficulties. There appears to be no difference in the prevalence rate of disabilities across gender and grade level (see Figure 6). The very low proportion of Grade 1 and Grade 4 children with moderate to severe disabilities (4%) may suggest that many children with those level of disabilities are most likely out of school.
We examined the numeracy competence of those Grade 1 and Grade 4 children who were reported to have no, mild, and moderate to severe disabilities (see Table 4). The data suggest that numeracy competence for Grade 1 children with moderate to severe disabilities is lower than those with mild and no disabilities. The difference in numeracy achievement between those with mild and moderate/severe is significant, F(2, 4118) = 13.1, p < 0.001. Grade 4 children with moderate to severe disabilities also scored lower than those with mild disability, but the difference was not found to be significant. Grade 4 children with no disability actually scored lower than those with moderate/severe disabilities, but again the difference was not significant.
Table 4. Descriptive statistics for sample children numeracy achievement across disabilities
| Grade | Group | N | Mean | SD |
|---|---|---|---|---|
| No disability | 3277 | 70.7 | 20.9 | |
| Grade 1 | Mild disability | 677 | 74.9 | 19.5 |
| Moderate/Severe disability | 167 | 68.4 | 22.6 | |
| No disability | 3294 | 45.1 | 19.2 | |
| Grade 4 | Mild disability | 689 | 49.2 | 19.5 |
| Moderate/Severe disability | 154 | 48.2 | 20.4 |
The fact that Grade 4 children with moderate/severe disabilities performed equally compared to those with no to mild disabilities may suggest that children with any kind of moderate to severe disabilities could perform well as long as they get the opportunity to be in school. Nevertheless, the very low proportion of children with moderate to severe disabilities may suggest that the primary education system is probably not suitable for those children with moderate/severe disabilities to attend school, or perhaps the proportion of children with moderate/severe disabilities in Ethiopia is probably very low. It should be noted, however, that comparison of the average numeracy scores between the three disability groups could be misleading because of the large variation in sample size between the three disability groups. It is also important to note that all of the children in our sample with moderate/severe disabilities are from primary schools in the relatively advanced regions: Addis Ababa (37.5%), Oromia (25%), SNNP (12.5%), Tigray (25%). This may suggest that children with moderate/severe disabilities in the emerging regions are probably out of school.
It was indicated as a key performance indicator in the ESDP V that the primary education GER for children with disabilities would increase nationally to 32 percent in 2016/17, but what was achieved was estimated to be only 7.8 percent, which is by far lower than the targeted goal (Ministry of Education, 2017). The government data also show a wide regional variation concerning primary education GER of children with disabilities. For example, in 2016/17, Tigray (18.3%), SNNP (18.9%), and Dire Dawa (11%) were among the regions that registered the highest primary GER for children with disabilities compared to those regions in emerging regions including Afar (0.3%) and Somali (0.1%). The very low GER in emerging regions suggests that access to primary education is still a huge challenge for children with disabilities in disadvantaged regions. Besides, the national 5 percent upper-primary GER is much lower than the 10.5 percent lower-primary GER, which clearly indicates that many children with disabilities are not progressing through the primary education system in Ethiopia. Lack of awareness and capacity to implement special needs educational activities and lack of educational resources for children with disabilities are among the factors that constrain access to primary education for children with disabilities in Ethiopia (Ministry of Education, 2015).
This Insight explored the prevalence of inequity in access to quality primary education for children in emerging regions’ and children with disabilities in Ethiopia. We particularly focused on schools in the emerging regions and assessed differences in student learning outcomes across gender and urban-rural localities. We also explored differences in girls’ enrolment in upper-primary education, school facilities for girls, distribution of educational resources, and primary school enrolment and learning of children with disabilities at the national level.
The findings on learning outcomes revealed that both girls and boys in emerging regions scored significantly lower in numeracy compared to their counterparts in the relatively advanced regions. On the enrolment of girls in upper-primary education, we found that Grade 8 girls’ enrolment in Somali is much lower compared to other relatively advanced regions. Schools in the emerging regions appear to be facing educational resource shortages and lack of essential school facilities compared to schools in Addis Ababa. On access to primary education for children with disabilities, our data indicate that many schools across the sample regions do not seem to have a reliable approach to properly identify children with disabilities. Most of the sample schools also do not seem to provide the required support for children with disabilities in terms of the provision of specially designed teaching and learning materials and training of teachers to teach children with disabilities. Moreover, our findings suggest that children in Grade 1 with moderate to severe disabilities score significantly lower in numeracy than other children with no or mild disabilities, while no such significant differences occur in numeracy scores among Grade 4 children across disabilities.
As indicated in the introduction, the current GEQIP-E educational reform constitutes a wide range of interventions to achieve equitable access to primary education for disadvantaged children and schools. We hope that the evidence from this baseline study will help all of the stakeholders in the GEQIP-E reform to understand and follow-up on whether those sets of interventions are successful in helping disadvantaged schools and children achieve the equity-related goals of the reform. More specifically, these baseline findings are expected to serve a few purposes in understanding how the GEQIP-E reform helps in narrowing the identified issues of inequity in Ethiopia.
First, the baseline data was collected in 2018/19 academic year right before the start of the implementation of GEQIP-E interventions. Since the RISE Ethiopia project will be following the same 166 schools and the same children (whether they are in or out of school) across regions over the next three years, we can track whether there is any improvement on inequalities related to learning outcomes, girls’ enrolment in upper-primary education and access to educational resources in the emerging regions, and enrolment and learning of children with disabilities in the sample regions.
Second, we followed the same Grade 1 and Grade 4 children over the 2018/19 school year and administered numeracy tests both at the beginning (November 2018) and end (June 2019) of the academic year. As soon as we get access
to the cleaned RISE Ethiopia endline numeracy data, we will start to compute numeracy learning gains of children in the emerging and relatively advanced regions by gender and rural-urban localities. We will be able to understand, for example, (i) the extent to which numeracy outcomes of girls in emerging regions improve over an academic year compared to girls and boys in the relatively advanced regions, and (ii) whether learning outcomes of children with disabilities improve over an academic year compared to other children. This kind of empirical evidence is hoped to bridge the information gap in low-income countries such as Ethiopia on how gender, disabilities, and living in a relatively disadvantaged region interact in influencing learning progress over an academic year.
Third, this Insight showed that there is diversity even within emerging regions on some indicators such as the establishment of girls’ clubs and the way children with disabilities are taught in schools. For example, schools in Be-Gu were found to be doing well on some indicators compared to the schools in Somali. Based on the baseline evidence, the RISE Ethiopia team will be able to track whether those differences found within the emerging regions at the baseline could impact the progress in numeracy competence for girls and boys over the academic year.
Fourth, the baseline data will help to understand the effectiveness of the various equity-focused interventions of GEQIP-E in addressing the issues of equitable learning in Ethiopia. We will get a better understanding of, for example, the extent to which children (and particularly girls) in emerging regions and children with disabilities all over Ethiopia benefit from GEQIP-E sets of interventions in terms of access to quality primary education compared to other children in urban centres.
To the best of our knowledge, no previous systematic efforts have been made in Ethiopia to understand the impact of a large-scale educational reform on equity with a detailed baseline data like the work of RISE Ethiopia, and with an intention to follow up with the same schools and the same children during the reform implementation period.
Asgedom, A., Hagos, B., Lemma, G. Rose, P., Teferra, T., Wole, D. and Yorke, L. 2019. Whose Influence and Whose Priorities? Insights from Government and Donor Stakeholders on the Design of the Ethiopian General Education Quality Improvement for Equity (GEQIP-E) Programme. RISE Insight Note. Retrieved 20 November 2019 from https://www.riseprogramme.org/publications/whose-influence-and-whose-priorities-insights-government-and-donor-stakeholders-design
Hoddinott, J., Iyer, P., Sabates, R. and Woldehanna, T. 2019. Evaluating Large-Scale Education Reforms in Ethiopia. RISE Working Paper 19/034. Retrieved 20 November 2019 from https://www.riseprogramme.org/publications/rise-working-paper-19034-evaluating-large-scale-education-reforms-ethiopia
Iyer, P. and Rossiter, J. 2018. Coherent for Equitable Learning Understanding the Ethiopian Education System. RISE Insight Note. Retrieved 20 November 2019 from https://www.riseprogramme.org/publications/coherent-equitable-learning-understanding-ethiopian-education-system
Ministry of Education. 2017. Ethiopian Education Statistics Annual Abstract. 2009 E.C. (2016/17). EMIS and ICT Directorate. The Federal Democratic Republic of Ethiopia, Addis Ababa. Ethiopia.
Ministry of Education. 2015. The Education Sector Development Programme V. The Federal Democratic Republic of Ethiopia. Addis Ababa, Ethiopia.
Ministry of Education. 1994. Education and Training Policy. The Federal Democratic Republic of Ethiopia. Addis Ababa, Ethiopia.
OECD. 2012. Equity and Quality in Education: Supporting Disadvantaged Students and Schools. OECD Publishing. Retrieved 21 November 2019 from http://dx.doi.org/10.1787/9789264130852-en
Rose, P., Singal, N., Bari, F. Malik, R. and Kamran, S. 2018. Identifying disability in household surveys: Evidence on education access and learning for children with disabilities in Pakistan. REAL Centre, University of Cambridge. DOI: http://doi.org/10.5281/zenodo.1247087
Rose, P. and Alcott, B. 2015. How Can Education Systems Become Equitable by 2030? DFID Think Pieces: Learning and Equity. HEART.
The World Bank. 2017. General Education Quality Improvement Program for Equity (GEQIP-E): Project Appraisal Document: Report No: 121294-ET. The World Bank.
UN General Assembly. 2015. Transforming our world: the 2030 Agenda for Sustainable Development. A/RES/70/1. Retrieved 07 November 2019 from https://www.refworld.org/docid/57b6e3e44.html.
Yorke, L., Rose, P., and Pankhurst, A. 2021. The influence of politics on girls’ education in Ethiopia. In P. Rose, M. Arnot, R. Jeffery and N. Singal (Eds.), Reforming Education and Challenging Inequalities in Southern Contexts. Research and Policy in International Development (pp. 98-119). London, Routledge.
The authors are grateful to Louise Yorke and Pauline Rose of the REAL Centre for their useful comments and suggestions on an earlier version of this paper. The corresponding author of this paper is Dawit Tibebu Tiruneh (dtt24@cam.ac.uk or dawittibebu@yahoo.com).
Tiruneh, D., Sabates, R., and Woldehanna, T. 2021. Disadvantaged Schools and Students in Ethiopia: Why is the GEQIP-E Reform Necessary? 2021/026. https://doi. org/10.35489/BSG-RISE-RI_2021/026