Michelle Kaffenberger
Blavatnik School of Government, University of Oxford
Blog


Using harmonized learning outcome (HCO) measurements, results show that average learning levels moved shockingly slow between 2000 and 2015—a pace that will take the typical country 143 years to reach average OECD levels.
The World Bank’s new Human Capital Index makes great strides in measuring human capital by explicitly including learning, not just schooling. The HCI uses harmonized learning outcomes (HLOs), developed by Altinok, Angrist and Patrinos (and updated by Patrinos and Angrist), as the comparable measure of education quality. The HLOs provide a wealth of information on learning by country and how learning changes over time.
We use these to examine changes in learning over the 15 years of HLO data. Spoiler alert: learning levels moved shockingly slowly between 2000 and 2015. The results show that current, “business-as-usual” progress will leave many children at low learning levels for generations to come. This reinforces a key RISE message that major system changes will be needed to address the learning crisis and accelerate the pace of progress in learning.
The HLOs bring together data from international and regional tests, including PISA, TIMSS, PIRLS, SACMEQ, LLECE, and PASEC, as well as Early Grade Reading Assessments (EGRAs). The authors developed and used conversion factors to generate comparable scores across all available test results. You can read more about the methodology here. The HLOs are scaled so that the average score among OECD countries is 500, and a score of 625 represents advanced attainment and 300 represents minimum attainment. All come from assessments that were conducted between 2000 and 2015.
While any exercise such as developing the HLOs has its pluses and minuses, this is not an effort to assess the HLO measure itself. Rather, we just take the data on an “as is” basis and examine what it implies about changes in learning outcomes.
To look at how learning levels change over time, we analyze the 131 countries (out of 157) that have HLO scores for more than one point in time. In our sample, the average HLO score is 434. Among the non-OECD countries in our sample, the average score is 405. The test is scaled so that the average of OECD countries is 500, and some successful non-OECD countries nearly reach, or even exceed the level of the average in the OECD. Turkey, for example averaged 459 in 2015. Vietnam - a standout success – averaged 519 in 2015, beating the UK which averaged 516.
Countries have on average 10.8 years between their earliest and most recent score (the longest span is 15 years and the shortest span is one year). We calculate the average change per year for each country using the simple difference between earliest and most recent score divided by the number of years in between.
We find that the typical pace of learning improvement is very slow.The median annual change in HLO points in our sample is 0.46 points (Figure 1). At this snail’s pace it would take 143 years to move even from the sample average of 434 to the OECD average of 500: that’s nearly six generations. One hundred forty-three years ago, the year was 1876—before light bulbs and automobiles—and that is how far into the future achieving even a modest goal will take at the current rate of progress.
Among non-OECD countries learning is increasing at a slightly more rapid pace, albeit from its lower average starting point. The median change per year for non-OECD is 0.93 points. To reach 500 points from the current average of 405 would still take 102 years.
The average changes per year are also highly concentrated around zero. Forty-three countries have an average annual change between negative one point and one point.
Figure 1. Average growth in learning per year is very low
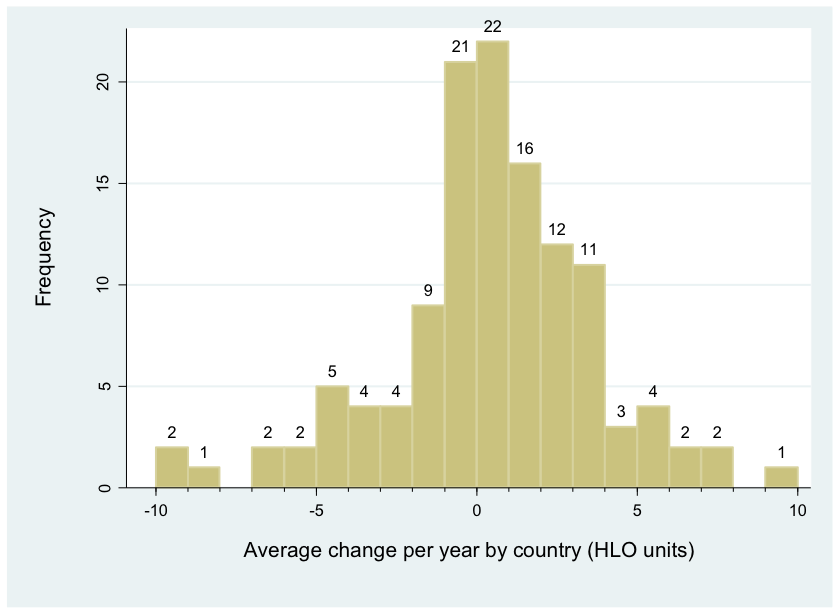
Source: Authors calculations from Human Capital Index data, available: http://www.worldbank.org/en/publication/human-capital
To dig deeper into these average results, we look at a few country examples. Peru has one of the higher gains from the sample, increasing its HLO score by 79 points between 2000 and 2015. This results in one of the highest annual gains, at 5 points per year. At this pace, as one of the best performing countries in our sample, it would take Peru 18 years to reach the OECD average of 500 points, assuming it can maintain its historical pace of learning, although, as the graph illustrates, progress from 2006 to 2015 has been much slower than the rapid increase from 2000 to 2006.
Figure 2. Peru’s total gain of 79 points averages to about 5 points per year between 2000 and 2015, with more rapid progress earlier than later in the period
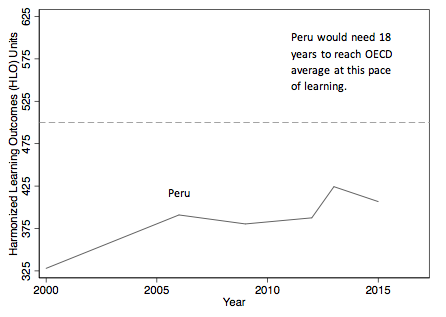
Source: Authors calculations from Human Capital Index data, available: http://www.worldbank.org/en/publication/human-capital
Most countries experienced less improvement than Peru. Indonesia and Colombia represent two more typical examples. Indonesia (Figure 3) illustrates a positive, but very slow, pace of learning. In total, Indonesia gained only 13 HLO points between 2000 and 2015. Its average annual increase was just 0.88 points, which is still higher than the sample average of 0.46. At this pace, Indonesia would take 110 years to reach the average OECD score. And this pace is optimistic relative to recent estimates of capability in arithmetic produced by the RISE team, from household panel data, that suggest there was zero progress between 2000 and 2014.
Figure 3. Indonesia averaged only 0.88 HLO point growth per year between 2000 and 2015
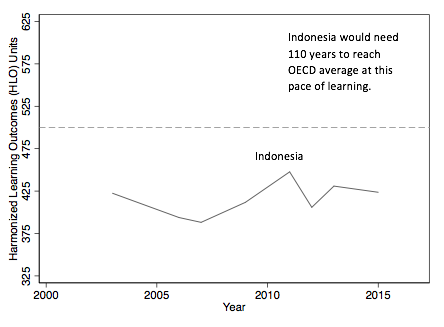
Source: Authors calculations from Human Capital Index data, available: http://www.worldbank.org/en/publication/human-capital
Colombia illustrates another way countries end up with flat learning. HLO scores in Colombia fluctuated quite a bit over the years. They declined between 2003 and 2007, followed by significant growth between 2007 and 2011. Then, an additional drop and climb resulted in an HLO score virtually indistinguishable from where Colombia began 12 years earlier. In total, Colombia gained one HLO point between 2003 and 2015. Its average change per year was just 0.1. Colombia will virtually neverreach OECD average scores without major changes – its average growth rate per year means it would need more than 700 years at its current pace.
Figure 4. While Colombia’s score fluctuated, it netted almost no growth in HLO score in 13 years
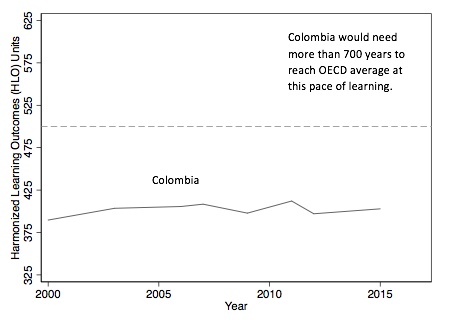
Source: Authors calculations from Human Capital Index data, available: http://www.worldbank.org/en/publication/human-capital
For more on how individual countries fared, feel free to peruse this chart which plots scores for each country individually on standardized scales.
That learning in developing countries is slow relative to the challenges faced isn’t new news. Beatty and Pritchett analyzed data from three sources—TIMSS, PISA, and SACMEQ—and found similarly slow paces of learning. Their calculations showed median growth in TIMSS scores of just 0.79 points per year; in SACMEQ scores of 1.15 points per year; and PISA scores of 2.6 points per year (all scaled so that 100 points is a standard deviation). Among developing countries, they found the median change in TIMSS mathematics score was negative, making it impossible to reach any (positive) target on current trends.
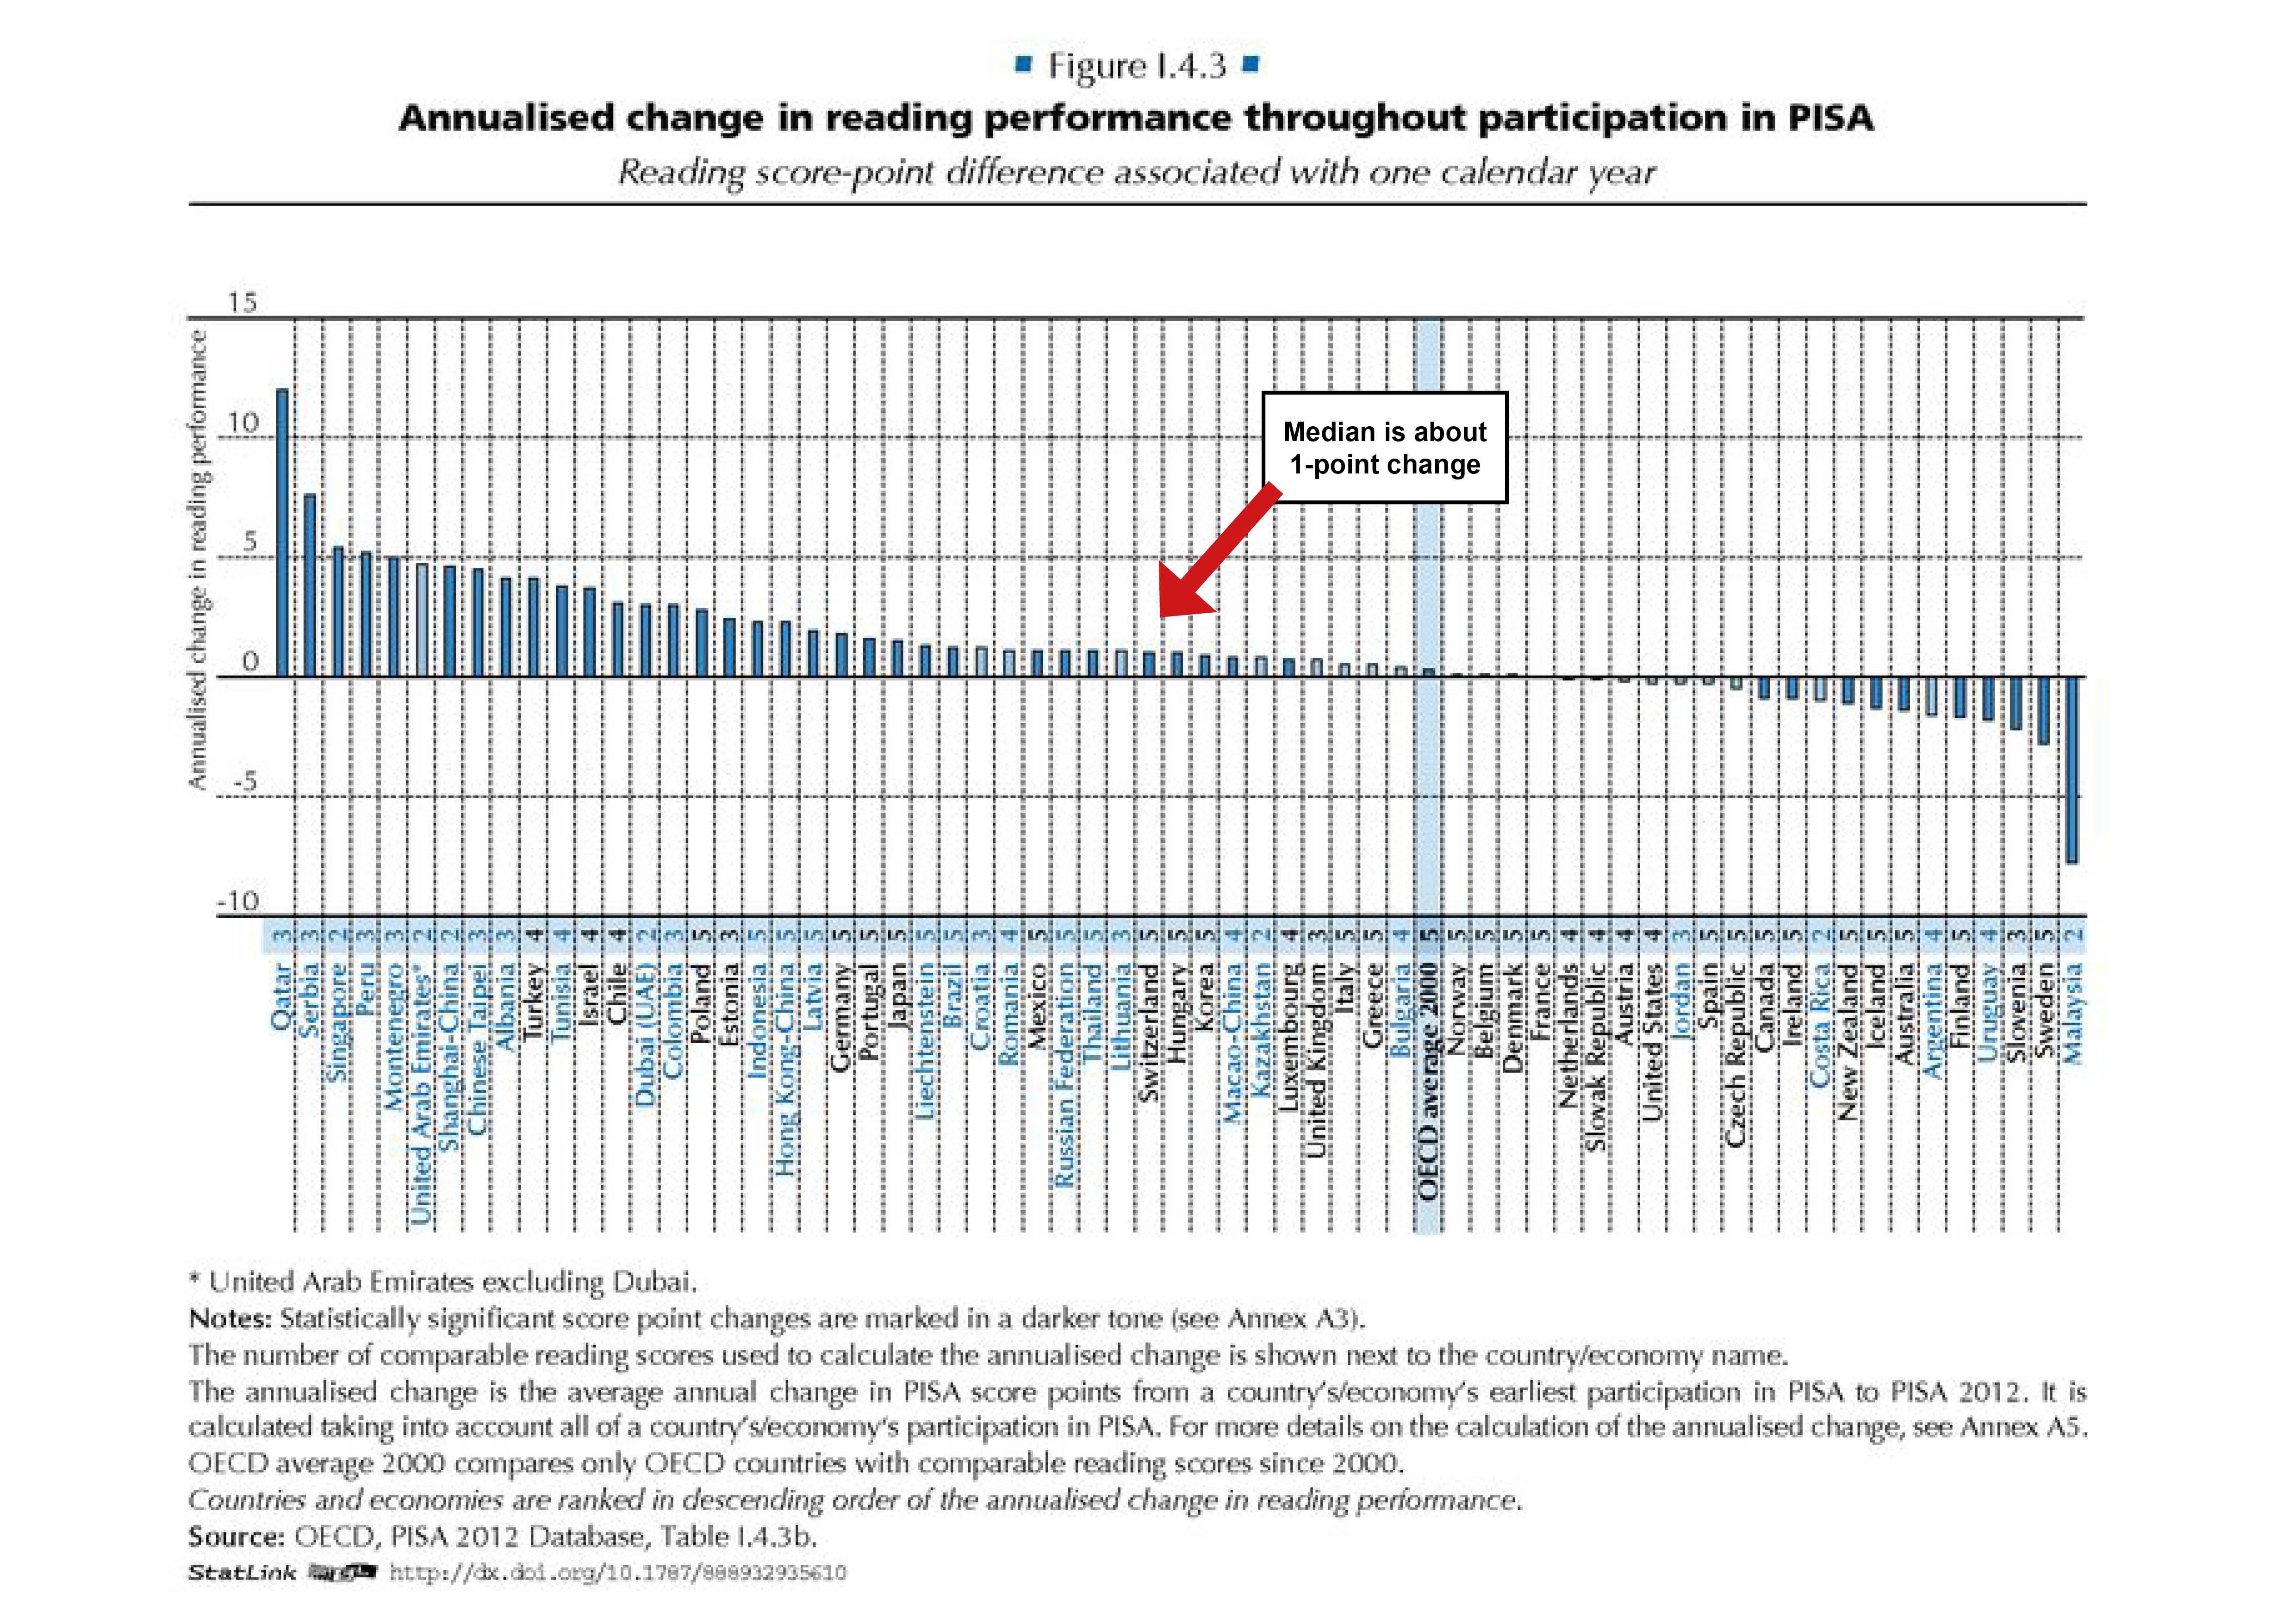
PISA also calculates changes over time, reporting on long-term average changes for countries participating in its testing. Between 2003 and 2012, the median change-per-year for PISA math scores was one point (Figure 5). Reading scores are similar. The median annual change between 2000 and 2012 is also around one point (Figure 6). Of course, since the HLO draws on the PISA it isn’t surprising the results are similar.
Figure 5. Median per-year change in PISA mathematics scores between 2000 and 2012 is one point
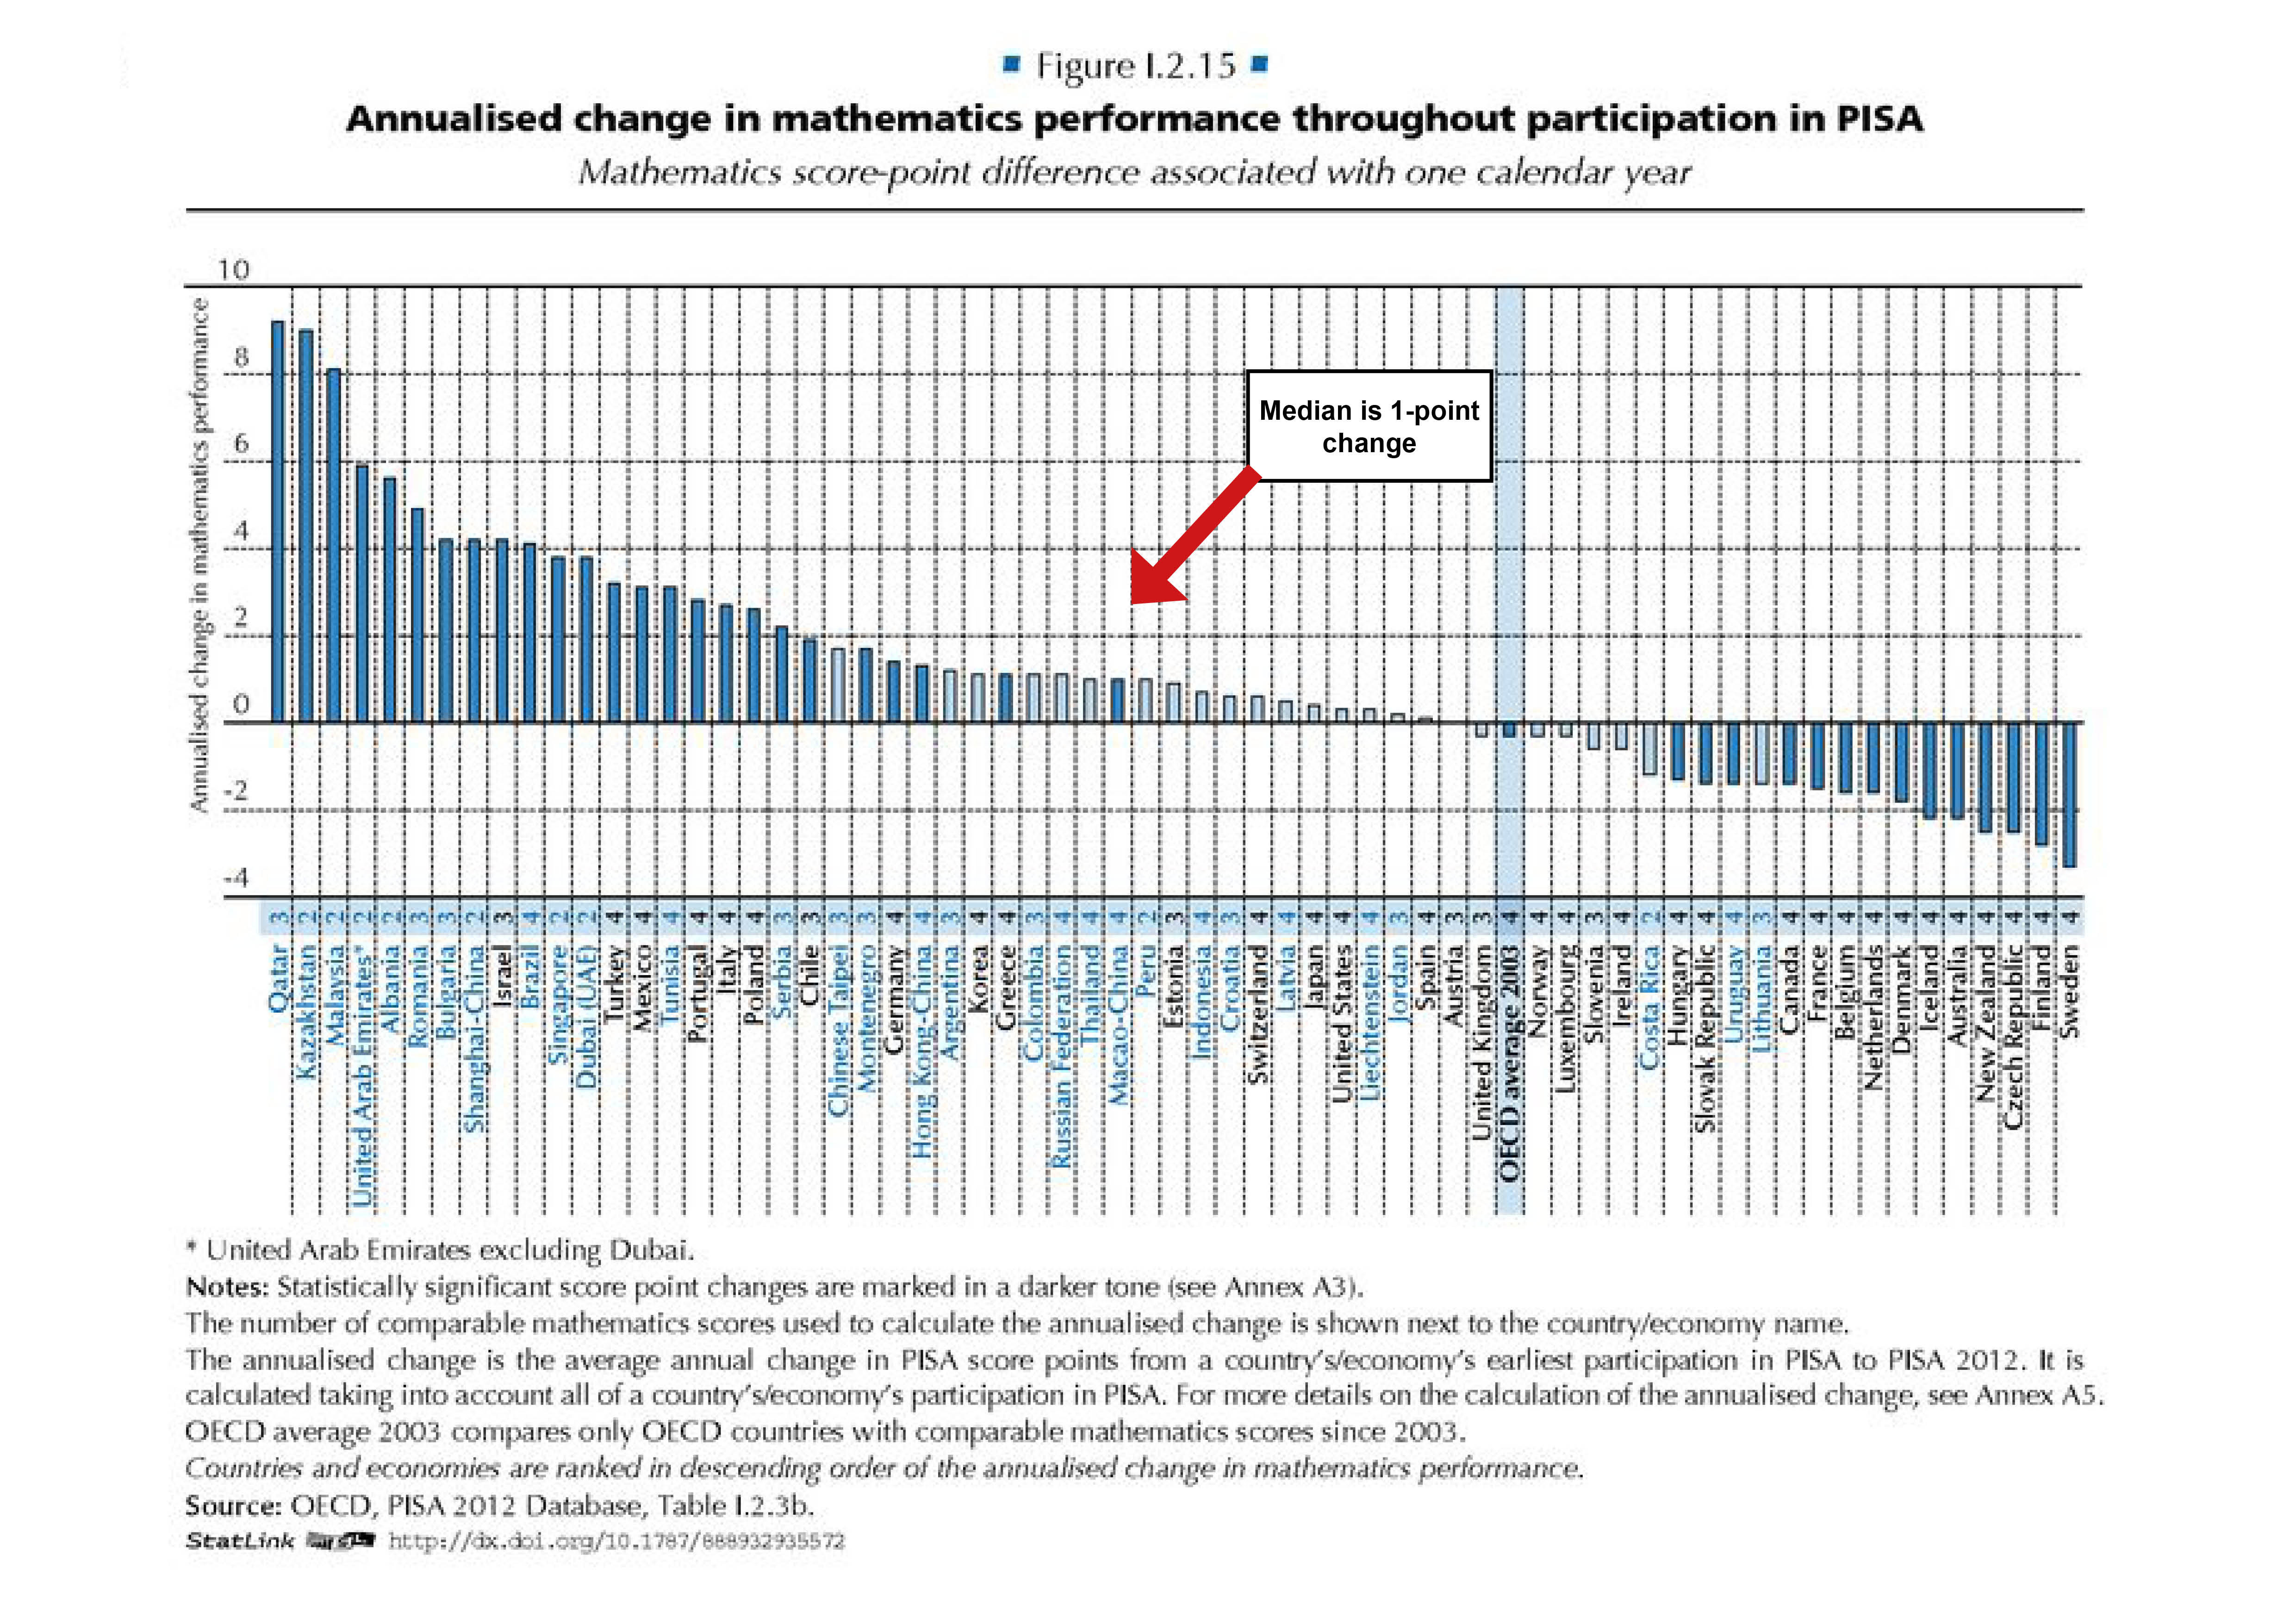
Figure 6. Median per-year change in PISA reading scores between 2000 and 2012 is also about one point
What do such slow paces of improvement mean for improving learning outcomes? To raise learning by the large amounts that are needed to address the learning crisis will require exponentially faster growth than what is currently occurring. Small tweaks and incremental adjustments are unlikely to achieve this pace of change. System-wide reforms—which make every level of an education system coherent to learning—will be needed to raise these rates and give each child a chance to gain the skills and capabilities an education should provide.
RISE blog posts and podcasts reflect the views of the authors and do not necessarily represent the views of the organisation or our funders.