Michelle Kaffenberger
Blavatnik School of Government, University of Oxford
Blog
The new Sustainable Development Goals (SDG) go beyond the commitment to just “completing primary school” of the Millennium Development Goals (MDG) and target learning outcomes. SDG Target 4.6 is: By 2030, ensure that all youth and a substantial proportion of adults, both men and women, achieve literacy and numeracy. As countries and supporters plan for this goal - that every child emerge into adulthood equipped, at a bare minimum with literacy - an important question is whether achieving this goal is possible with just more schooling or will countries also have to improve the learning per year of schooling?
We take this question up in a new paper with the RISE Programme using recent data from ten developing countries from the Financial Inclusion Insights (FII) surveys. We find, shockingly, that in these countries only about half of adult women who reported completing primary school could read a few simple sentences. The learning profile, the additional mastery of literacy associated with additional schooling, is so weak that even had the MDG of universal primary completion been achieved, this would have increased literacy on average by only eight percent in these ten countries. In the paper, we show that achieving universal literacy will require both more schooling and more learning while in school - and this is especially true for girls.
The FII survey enumerators asked the respondent to read a few sentences (a consent form) and assessed whether they could read well, poorly, or not at all. Combining this simple indicator of literacy (and this is a very, very low standard) with the highest level of schooling reported, creates retrospective learning profiles - the association of the literacy level of adults with levels of schooling. The Demographic and Health Surveys (DHS) added a similar reading test in recent rounds and Pritchett and Sandefur (2017) recently used this data to create retrospective learning profiles.
The addition to simple assessments of reading to adult multi-module surveys has advantages and disadvantages. An advantage is that this approach assesses an entire cohort whereas most in-depth testing of reading and math knowledge (e.g. PISA, TIMSS, SACMEC, etc.) assess only enrolled students in a given grade or age. This means the learning profiles can compare learning levels of adults with different grade attainment levels. Another advantage is that assessing adults (which is rarely done in developing countries) reveals retained learning rather than a skill that may have been incompletely or temporarily mastered and forgotten, and hence not part of an adult repertoire of useful competencies. One disadvantage is they rely on a very simple measure of reading. Another disadvantage is that all results are retrospective and represent the results of learning processes from past decades.
We compare young adult women who completed grade six (DHS assessed only women and did not assess women with more than primary schooling) and those women in the FII who completed primary. Across the ten countries in common, the average literacy of primary school completers in the FII was 48.8 percent and 51.1 percent in the DHS. There are some differences, for example, Ghana has much higher literacy in FII than in DHS, and Uganda has higher literacy in DHS than FII. But for many countries, the results are remarkably similar (29.5 percent versus 32.6 percent in Bangladesh) and the correlation was 0.77.
Table 1: Assessed ability of women with just primary education to read a simple sentence or passage is similar between the DHS and FII data
| Country | DHS, women 25-34, highest grade was 6th, percent able to read all of a sentence | FII survey, women aged 18-37, completed primary, able to read a three-sentence passage |
| Nigeria | 12.0% | 15.4% |
| Uganda | 54.4% | 23.2% |
| Bangladesh | 32.6% | 29.5% |
| Pakistan | 50.7% | 44.2% |
| India | 34.6% | 49.0% |
| Kenya | 65.3% | 69.7% |
| Indonesia |
75.2% |
76.7% |
| Tanzania | 86.2% | 82.5% |
| Ghana | 7.7% | 47.9% |
| Rwanda | 97.1% | 77.7% |
| Average | 51.4% | 48.8% |
Source: Kaffenberger and Pritchett (2017) and Pritchett and Sandefur (2017)
We use the FII data to calculate two key scenarios:
In most countries, UPC yields only small gains in literacy
We calculate literacy under UPC by attributing to all people with either “no formal education” or “some primary” the literacy level of those with “primary complete”. This is an optimistic scenario as if those who dropped out of primary school were already falling behind, and therefore, they are likely to have lower learning levels upon completion and hence our calculations would overestimate resulting literacy levels.
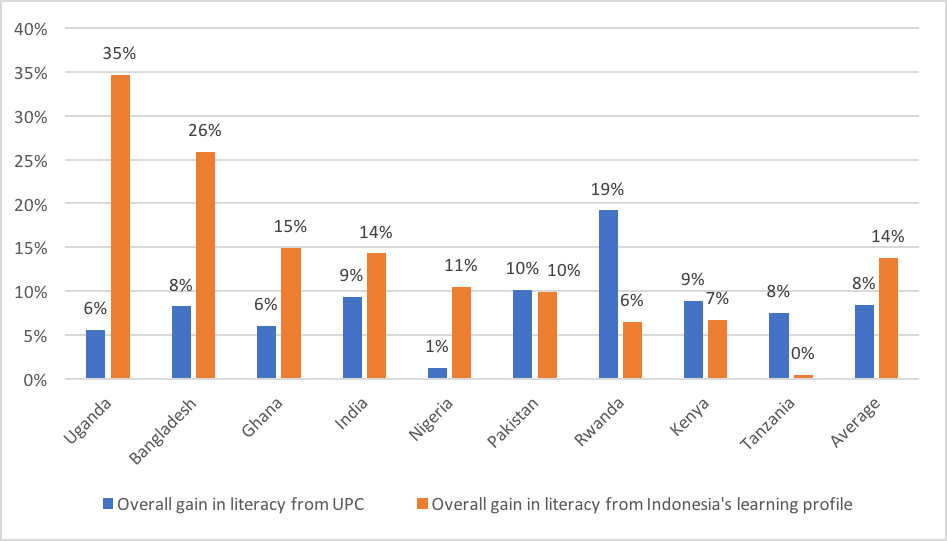
On average, achieving UPC would have increased overall literacy by only about 8 percentage points, to 73%, leaving more than a quarter of adults illiterate – and countries far from universal literacy. In countries with very shallow learning profiles and few primary school completers who could read, like Uganda and Nigeria, UPC would have only increased literacy by 5.6 and 1.3 percentage points, respectively. Other countries fare better – Kenya and Pakistan gain 9 and 10 percentage points each. In Rwanda, where many were out of school as children, those who attended school mastered literacy in primary school. Therefore, the gains from UPC would have been large.
Figure 1. Gains from improving learning are typically much larger than from achieving UPC, especially in countries where learning is weak (Uganda, Bangaldesh, Ghana, Nigeria)

Source: Kaffenberger and Pritchett, 2017
In many countries, gains from improving learning are two to ten times larger
What if we instead shifted learning profiles? Indonesia has the highest literacy rate of the ten countries and so we do simulations with Indonesia’s learning profile. This is a low standard as Indonesia’s PISA reading score of 382 in 2003 was the second lowest of participating countries. This represents an achievable (incremental) aspiration for currently low-learning-level countries. We calculate literacy rates for the other nine countries as though their learning profiles “shifted” to match Indonesia’s – schooling attainment stays constant, but literacy rates match those of Indonesia at each schooling level.
For countries where learning is weak, steepening to match Indonesia results in massive improvements in literacy. In Uganda, literacy increases nearly six times as much as in the UPC scenario – with no changes in enrollment. In Nigeria, the gain is eleven times larger than UPC. Only in Rwanda and Tanzania, where learning is already high, does achieving UPC result in substantially larger gains than improving the learning profile.
One advantage of the FII data over the DHS is that both sexes were respondents. This allows us to add a new scenario: what if women had the same grade attainment levels as men?
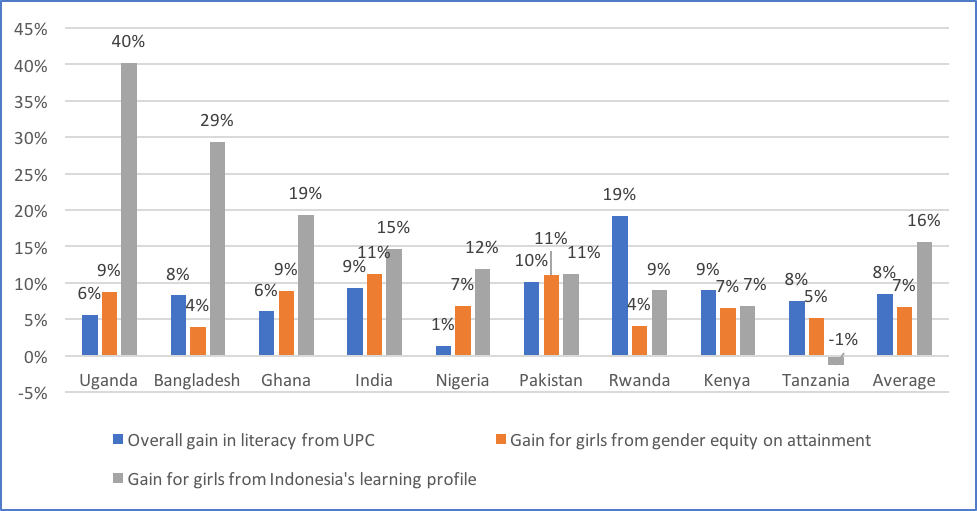
In most countries, the gain from gender equity in schooling completion is modest, and nearly always much smaller than the gain from a steeper learning profile (Indonesia’s). For instance, in Ghana, equalizing women’s to men’s schooling attainment would have reduced female illiteracy by nine percent. But if both boys and girls had mastered literacy in Ghana, as they did in Indonesian schools, literacy would have risen by nineteen percent.
Gender equality without improved learning is not an agenda that will achieve the SDG of literacy for girls.
Figure 2. On average, the gains for girls from shifting learning profiles is double that of UPC or gender equity

Source: Kaffenberger and Pritchett, 2017
These scenarios show that achieving universal literacy, or any other goal related to quality education, will require not just more schooling, but more learning for each year of schooling, in most countries. And this is particularly true for girls, who stand to gain the most from improved learning for all.
RISE blog posts and podcasts reflect the views of the authors and do not necessarily represent the views of the organisation or our funders.