Michelle Kaffenberger
Blavatnik School of Government, University of Oxford
Blog
“My children will not go to the government school because they say there is no education” – Bharat Lal, a laborer in Uttar Pradesh, as told to the Economist

One wonderful thing about technology is that sometimes it connects you with people who have already done most of the work for you. If one wants to know how children in different countries progress through school, and what that implies about the prospects for reaching targets of universal secondary schooling through a “more access” strategy, most of the hard work is already done. Deon Filmer at the World Bank, who headed the recent World Development Report on education, has created and maintained a website that has graphs and data on grade attainment using 568 data sets from 119 countries. This allows easy examination of the evolution of grade attainment profiles over time (and differences in these profiles by sex, by urban/rural residence, by household wealth). It is truly a spectacular resource that can be used for all kinds of analysis.
In this blog, we will examine how much strategies that focus just on expanding physical access to schools can contribute to reaching goals of universal secondary completion. It is easy to see that, while the world has made great strides in expanding access to schooling and reaching (near) universal initial enrollment, the phenomena of “within-cycle” drop out (children who drop out within primary school or within the junior secondary cycle) suggests that factors that impact retention (like learning quality) will be essential to increase grade attainment—and achieve learning goals.
The world has made great strides in expanding children’s schooling in recent years. The proportion of children who have never attended school has dropped precipitously in many countries. In India, 24 percent of 30-39-year-olds (who would have started school about 25-34 years ago) never attended primary school. Among 15-19-year-olds, only 5 percent did not (Figure 1—using data from Filmer’s website). Much of the “never attended” problem was directly caused by a lack of physical access to primary schools and building out the system was necessary to attract these children into school. And, with relatively low primary cycle drop out (through Grade 5 in India), the percent completing primary school rose from just 68 percent to 91 percent. This is a huge success over a relatively short time period.
Figure 1. In India attainment increased at every grade level over 20 years, and Grade 1 attainment is now nearly universal
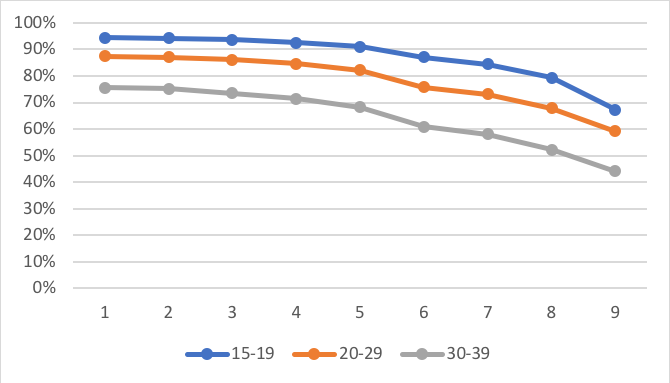
Source: Based on analysis of 2015-2016 DHS attainment data available http://iresearch.worldbank.org/edattain/
But, learning is in crisis, and international goals have rightfully shifted to a focus on learning outcomes. To ensure children learn more, there is a temptation to build on the success with primary school by focusing on expanding secondary school access—build more schools, children will come, and learning will follow (so goes the thinking). But what if access isn’t the binding constraint? What if the schools are there, but they are so poorly oriented towards learning that children do want not attend? The ASER 2016 data from Uttar Pradesh show that the problem the laborer in Uttar Pradesh identified (quote at the top of this blog) is very real. They find that, stunningly, a quarter of children who reach Grade 8 (end of the primary cycle) cannot read a Grade 2 text, and more than half (57 percent) cannot do simple division.
If access to secondary school is a major constraint to further schooling (and learning), then we would expect to see significant drop out when children move from primary to secondary school. If children start primary or secondary school, they clearly have physical access to a school of that level. Access-related constraints will therefore be (mostly) limited to those who do not enroll at the beginning of each schooling level, when physical access changes—a child who went to first grade has access to second grade and a child who starts at the first grade of junior secondary has physical access to the next grade (recognizing that some children will move, or schools could close, but these will be relatively less common). Drop out that occurs within primary or within secondary school levels, on the other hand, is likely driven by issues other than access (with the proviso that students might anticipate the lack of access of the next level and drop out of their current level knowing they won’t have future access).
We examine this timing of drop out using Demographic and Health Survey (DHS) data from five low- and middle-income countries, including some of the most populous, and focus on the cohort of 15-19-year-olds. We are looking at just five countries to illustrate the decomposition—but these same data are already available in comparable form for 119 countries. We look at schooling attainment and drop out through lower secondary completion (which some call “basic” combining primary plus junior secondary), which is Grade 8 in India, Pakistan, and Kenya, and Grade 9 in Indonesia and Nigeria.
Among these countries, all begin with high levels of initial primary attainment—in Indonesia 99 percent of 15-19-year-olds attended Grade 1, and in Kenya 98 percent did (Figure 2). Even Nigeria, which scores 152 out of 157 countries on the World Bank’s new Human Capital Index, has achieved nearly 80 percent attainment for Grade 1. Completion through lower secondary school varies, however. In Pakistan more than half of 15-19-year-olds did not complete lower secondary (either by dropping out or never starting school), and in Nigeria 47 percent did not. In Indonesia and India about a fifth did not complete lower secondary.
Figure 2. Grade 1 attainment is high
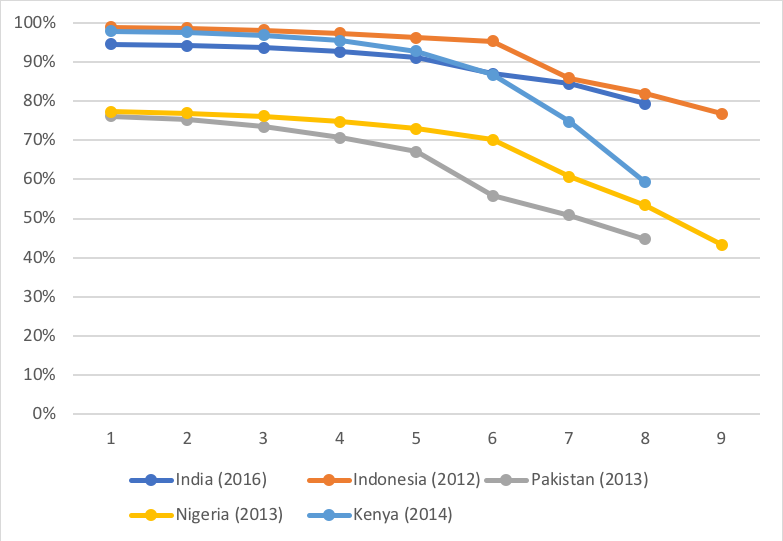
Source: Based on analysis of DHS attainment data available: http://iresearch.worldbank.org/edattain/
To understand drop out, we analyze simple counterfactuals. All countries have some level of drop out through the primary schooling years. So even if there were no access issues at the transition to (junior) secondary, we would still expect some drop out between primary and secondary levels just as a continuation of the within-cycle drop out patterns. To make a guesstimate of the between-cycle drop out that is due to the transition from primary to secondary, we analyze a counterfactual for what drop out would have been if it had continued at the same rate as the last year of primary. Then, we look at the difference between this counterfactual and the level of drop out we see in the data. The difference is the “excess” between-cycle drop out that might be attributable directly to physical access issues.
Figure 3. Example counterfactual for Nigeria
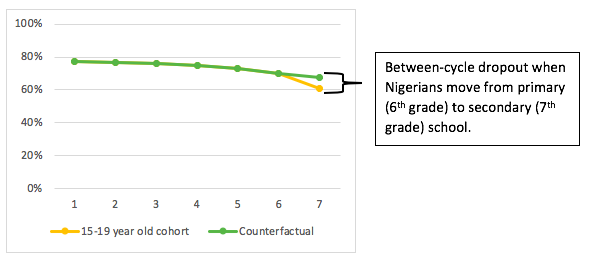
Source: Based on analysis of DHS attainment data available http://iresearch.worldbank.org/edattain/
Our simple and crude counterfactuals show that only a small proportion of children leave school between schooling levels. In all five countries, less than 10 percent of the full cohort dropped out of school in the transition from primary to secondary school. This represents only a small portion of the total deficit in lower secondary completion. If we erased between-cycle drop out altogether, this would reduce the total deficit from universal completion of basic education (primary plus lower secondary) by 15 percent or less in all countries except Indonesia.
In all five countries, within-cycle drop out represents a much larger portion of the total deficit. In Kenya 80 percent of the deficit is due to within-cycle drop out, as is about 60 percent in both India and Indonesia.
In Pakistan and Nigeria, “never-enrolled” is also an issue—about 25 percent of the cohort in each never started primary school (though the situation could have improved recently as the data represents those who were 15-19 years old in 2013, so today’s 5-year-olds may have higher primary attainment rates).
Figure 4. Between-cycle drop out is small, and within-cycle drop out is large, in all five countries
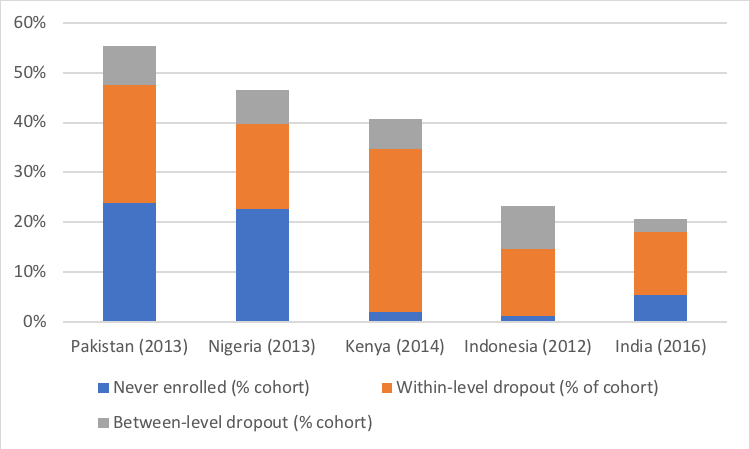
Source: Based on analysis of DHS attainment data available http://iresearch.worldbank.org/edattain/
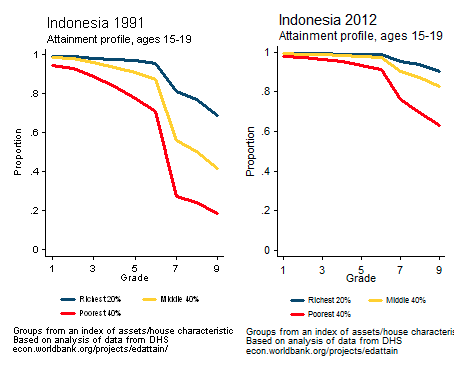
Looking more closely at Indonesia’s experience is helpful in understanding the evolution of the issues. If one looks at the grade attainment profiles from Indonesia in 1991 and 21 years later in 2012, stratified by household wealth (bottom 40 percent, middle 40 percent, top 20 percent—and again all of these graphs, across time, differentiated by wealth, sex and region are just waiting to be used on Filmer’s website) one sees a massive decline in between-cycle drop out (between primary [Grade 6] and junior secondary [Grade 7]) between 1991 and 2012, particularly among the poor. The overall progress for the poor involved little change in “never enrolled” as this was low even by 1991, substantial progress in within-primary-cycle retention (less than 70 percent of children from poor households finished primary in 1991), and a big reduction in drop-out across the primary to junior secondary cycle. So, while in 1991 between-cycle drop out was a primary concern, particularly for the poor, today, retention of children who start a cycle but do not complete it is a larger issue.
Figure 5. Evolution of between- vs. within-cycle drop out in Indonesia
Source: Based on analysis of DHS attainment data available: http://iresearch.woFigure 5rldbank.org/edattain/
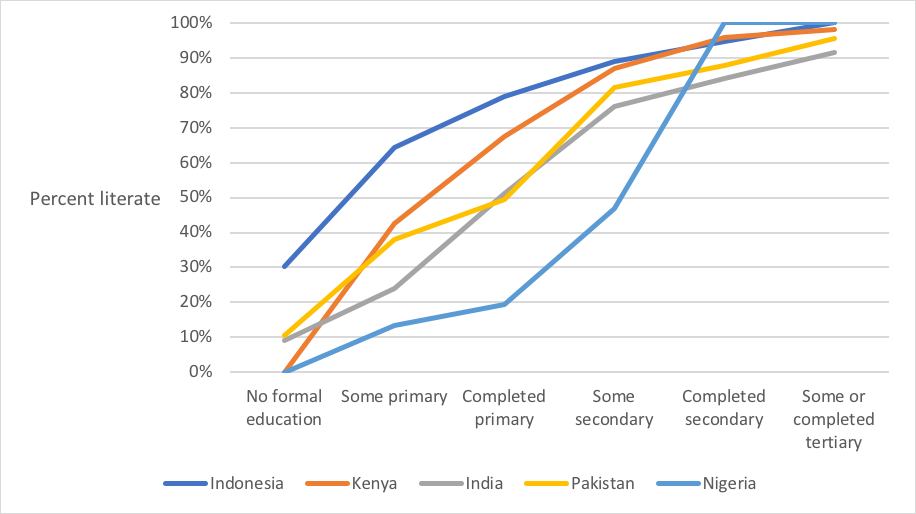
What might be driving the relatively high levels of within-cycle drop out? There are likely multiple factors, and one is suggested by looking at learning profiles. Analysis of the learning profiles in literacy acquisition in these five countries shows that learning in the early schooling years varies massively and on average is very low (Figure 6). The laborer in Uttar Pradesh, quoted at the top of this blog, summarizes the sentiment well—if kids aren’t learning much, they may be choosing to drop out. In Nigeria 80 percent of those who completed primary school had not obtained even basic literacy, and in Pakistan and India half had not. It’s hard to blame kids for thinking they have better ways to spend their time than persisting in schools that are not providing them any education.
Figure 6. Literacy rates by schooling level vary massively and on average are low, with many completing primary illiterate
Source: Calculations based on Kaffenberger and Pritchett (2017) https://www.riseprogramme.org/publications/rise-working-paper-17012-more-schooling-or-more-learning-evidence-learning-profiles
If drop out is mostly occurring within schooling cycles, and this is in part a response to low learning, then “more only” strategies of just building more schools will not solve the learning crisis. On top of that, forcing children into schools where they are not learning won’t help reach learning goals anyway, as multiple RISE studies show.
Even if there are large deficits in secondary completion just “build more schools” may not accomplish the goal of “more learning”—or even more completion. Instead we need to look at the education systems that are producing low learning levels and high rates of within-cycle drop out. If you build not only schools but an education system where children are enabled to gain the skills and capabilities they will need as adults, maybe they will come.
RISE blog posts and podcasts reflect the views of the authors and do not necessarily represent the views of the organisation or our funders.