Michelle Kaffenberger
Blavatnik School of Government, University of Oxford
Blog
PISA for Development (PISA-D) results show shockingly low levels of students achieve minimum proficiency in reading and math, highlighting how far the world is from reaching SDG4.
Internationally comparable data on learning levels in developing countries is severely limited. Most do not participate in international assessments such as PISA or TIMSS, and low average learning levels mean even when they do, the tests usually target too high of a skill level to be relevant for many students. PISA for Development (PISA-D) is starting to address this and recently released its results—showing learning is even lower than may have been expected, and highlighting the massive improvements needed to achieve even minimum universal proficiency in reading and math.
Launched in 2014, PISA-D adapted the PISA instrument to allow better assessment of students at the lower end of the skills distribution (something the traditional PISA doesn’t capture so well). Seven countries participated in implementing the new test—showing courage as they opened their education systems and students’ performance to public scrutiny. These countries included Cambodia, Ecuador, Guatemala, Honduras, Paraguay, Senegal, and Zambia. The assessments (like the traditional PISA) covered 15-year-olds who were in school and in at least Grade 7 at the time of the test, and are on the standard PISA scale with an OECD mean of 500 and standard deviation of 100.
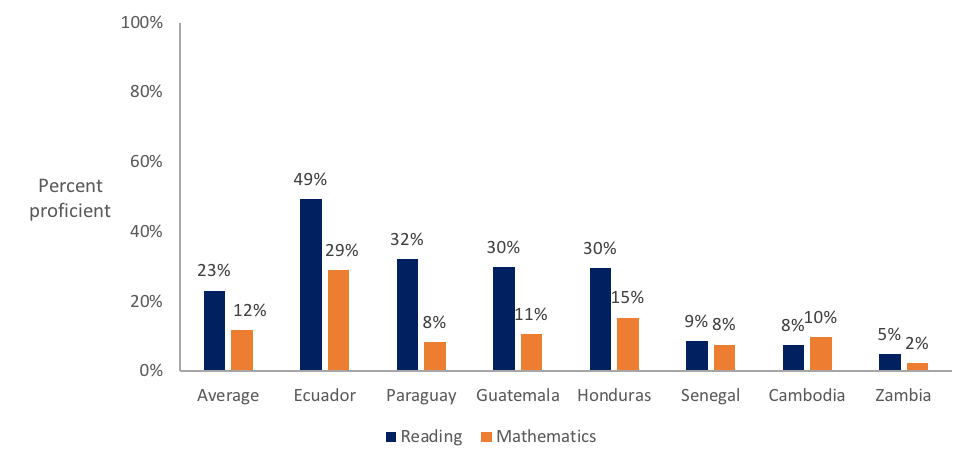
The new PISA-D results reveal exceptionally low scores for participating countries. Only 23 percent of students tested achieved the minimum level of proficiency in reading, compared with 80 percent of OECD. Minimum proficiency corresponds with a PISA Level 2, indicating an ability to read “simple and familiar texts and understand them literally”, as well as demonstrating some ability to connect pieces of information and draw inferences. This represents a relatively low bar for reading proficiency. It is also an important marker as it aligns with SDG 4’s target for all young people to achieve “at least a minimum proficiency level in reading and mathematics” by 2030. The PISA-D results show that to reach the SDG reading target, average proficiency levels among 15-year-olds in school in these countries would need to quadruple—and this does not account for children out of school in these countries.
And that is the average. In Zambia far fewer—only 5 percent of test takers—achieved minimum reading proficiency. Its average reading score of 275 is more than two standard deviations below the OECD mean of 500. Ecuador was the best performing, but still only 49 percent reached minimum proficiency; its average score was 409.
For math, only 12 percent of students in PISA-D countries achieved minimum proficiency. Zambia again scored the worst with only 2.3 percent reaching minimum math proficiency, followed by Senegal (7.7 percent) and Cambodia (9.9 percent). Ecuador was again the best performer, but with an average score of only 377 and 29 percent of its test takers achieving minimum proficiency.

Source: PISA for Development
To make matters worse (as if things didn’t sound bad enough already), the fact that PISA-D only tests children who are in school means these scores are likely higher than they would be if all children, both in and out of school, were included. Because poorer performing students are more likely to drop out (either through self-selection, parental selection to only send their best-performing children, failure to progress to the next grade or to pass a leaving exam, or any number of other reasons), these test scores that only include those who have persisted in school to age 15 are almost surely biased upwards.
PISA-D reports that on average only 43 percent of 15-year-olds—less than half!—were in school and in at least Grade 7, and therefore eligible for the assessment. In the OECD, that figure is more than double—with 89 percent eligible. Ecuador had the highest percent eligible at 60.6 percent, while three countries had only around 30 percent eligible, including Cambodia, Senegal, and Zambia.
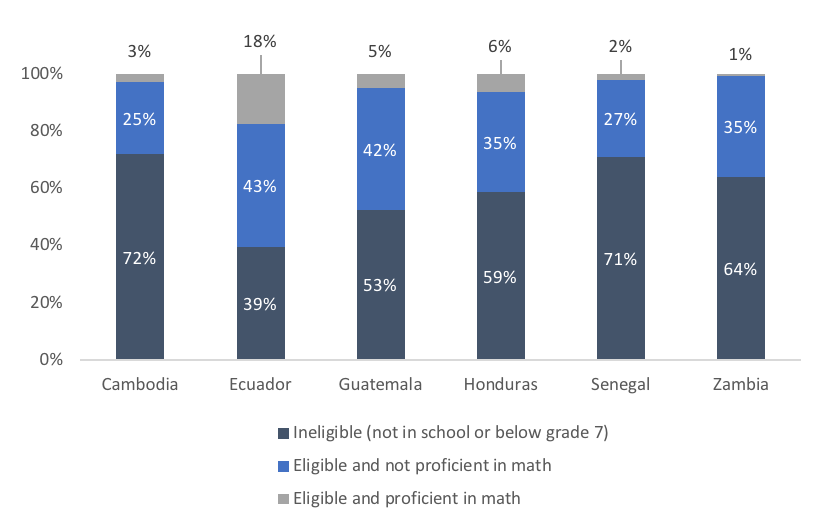
In Senegal only 2 percent of the 15-year-old cohort demonstrated proficiency in mathematics.
With so many young people out of school or years behind the grade they should be in, those who demonstrated proficiency represent a much smaller portion of the 15-year-old cohort than the initial figures suggest. (Now, some who were ineligible would likely be proficient, but they weren't able to demonstrate this proficiency because they are either too far behind in grade levels or have dropped out of school.)
Ecuador, for example, had the highest level of proficiency in math, at 29 percent of test takers, and the highest level of eligibility for the test. Yet across all 15-year-olds, this means only 18 percent demonstrated proficiency in mathematics on the PISA-D. All other countries perform even worse. In Senegal, low eligibility levels combined with low proficiency mean only 2 percent of 15-year-olds were both eligible for the test and demonstrated proficiency. Reaching the SDG for universal numeracy is a long way off.

Note: Eligibility figures for Paraguay are undergoing revision and therefore not reported.
Source: PISA for Development
Finally, these new PISA-D results provide an opportunity to update other attempts to compare learning across countries. The World Bank recently undertook an effort to create new, comparable measures of learning, as inputs to its Human Capital Index. The new Harmonized Learning Outcomes (HLOs) were developed by creating conversion factors and linking a multitude of assessments to a common scale. The exercise included international assessments (PISA, TIMSS, PIRLs), regional assessments (LLECE, PASEC, SACMEQ), and Early Grade Reading Assessments (EGRA) and generated comparable learning measures for 157 countries, including all seven that participated in PISA-D (read more about the methodology here and here).
The PISA-D results reveal that all seven countries scored lower than their HLO scores would have suggested. Learning is lower, and the need for improved learning greater, than indicated even by the most thorough current attempt to compare countries internationally. The results also illustrate the difficulty in converting different tests to a common scale, especially as it appears (based on this very small sample) that some assessments converted to the common scale better than others. (Scores drawing from LLECE were consistently closer to PISA-D results than those drawing on other sources—see Table 1.)
Table 1. PISA-D scores compared with the World Bank Harmonized Learning Outcomes scores
| PISA-D Scores | HLO Scores | ||||||||
|---|---|---|---|---|---|---|---|---|---|
| Reading | Math | Science | Average PISA-D score across the 3 subjects | Most recent HLO Score | Year of most recent score | HLO test source | Difference (HLO-PISA-D) | ||
| Cambodia | 321 | 325 | 330 | 325 | 452 | 2012 | EGRA | 127 | |
| Ecuador | 409 | 377 | 399 | 395 | 420 | 2013 | LLECE | 25 | |
| Guatemala | 369 | 334 | 365 | 356 | 405 | 2013 | LLECE | 49 | |
| Honduras | 371 | 343 | 370 | 361 | 400 | 2013 | LLECE | 39 | |
| Paraguay | 370 | 326 | 358 | 351 | 386 | 2013 | LLECE | 35 | |
| Senegal | 306 | 304 | 309 | 306 | 412 | 2014 | PASEC | 106 | |
| Zambia | 275 | 258 | 309 | 281 | 358 | 2013 | SACMEQ | 77 |
Sources: PISA for Development, https://doi.org/10.1787/c094b186-en; The World Bank Human Capital Index, http://www.worldbank.org/en/publication/human-capital
Learning is clearly in crisis, and the new PISA-D results add to the mountain of evidence showing the situation is indeed critical. With only 12 percent of students who are in school minimally proficient in math, more years of school are unlikely to generate the large gains needed. Other business-as-usual efforts, such as more spending or schooling inputs, will also struggle to achieve major improvements without a broader reorientation of the system towards learning. The RISE Programme, along with partners, is working to identify ways to bring education systems into alignment around learning, so that more children can gain the basic skills they need to realize their potential.
RISE blog posts and podcasts reflect the views of the authors and do not necessarily represent the views of the organisation or our funders.