Shardul Oza
Georgetown University
Insight Note


An estimated 1.29 billion students across the world have suffered from school closures. The impacts of school closures on student learning loss will clearly be largest for poor households and poor countries, where households have limited resources to access remote learning or conduct home schooling. There is the additional concern that many students will not return to school once they open. UNESCO estimates that by the end of January 2021, schools in sub-Saharan Africa were closed for 24 weeks on average.1 National governments and the international community responded rapidly to these school closures, by organising remote learning opportunities.2 However, early studies showed that the penetration of EdTech was weak.3
In this Insight Note, we report results of a phone survey that the RISE Tanzania Research team conducted with 2,240 parents (or alternate primary care-givers) of primary school children following the school closures in Tanzania. After the first case of COVID-19 was confirmed in Tanzania on 16 March 2020, the government ordered all primary schools closed the following day. Schools remained closed until 29 June 2020. Policymakers and other education stakeholders were concerned that the closures would lead to significant learning loss if children did not receive educational support or engagement at home. To help stem learning loss, the government promoted radio, TV, and internet-based learning content to parents of school-age children. The primary aims of the survey were to understand how children and families responded to the school closures, the education related activities they engaged in, and their strategies to send children back to school. The survey also measures households’ engagement with remote learning content over the period of school closures. We supplement the findings of the parent survey with insights from interviews with Ward Education Officers about their activities during the school closures.
The survey sample is comprised of primary care-givers (in most cases, parents) of students enrolled in Grades 3 and 4 during the 2020 school year. The survey builds on an existing panel of students assessed in 2019 and 2020 in a nationally representative sample of schools.4 The parent surveys were conducted using Computer Assisted Telephonic Interviewing (CATI) over a two-week period in early September 2020, roughly two months after the re-opening of primary schools.
We report the following key findings from this survey:
There are formidable challenges to conducting a remote, phone-based survey in a low-resource and low-connectivity setting such as Tanzania. During the survey design process, the researchers spoke to other teams that had conducted phone-based surveys during the COVID-19 pandemic to learn best practices in the area of phone-based interviewing. The research team also leveraged insights from previous experiences conducting and managing phone surveys. Data was collected electronically using a Computer Assisted Telephonic Interviewing (CATI) platform called Surveybe. The team partnered with UK-based survey firm EDI Global to administer the survey.
We designed the survey instrument with the limitations of the interviewing mode in mind. For example, we restricted the survey to a length of 15-20 minutes because we knew that respondents may be unwilling to commit to more time and decreased respondent attention impacts data quality. When possible, we used “Yes/No” questions since these questions are easier for respondents to reply to over the phone. We piloted the instrument and obtained feedback from survey staff on question wording prior to conducting the survey.
To maximise response rates, interviewers collected multiple phone numbers for each household (when available) and placed an initial call during which they obtained the respondent’s consent and scheduled a day or time for the interview. In many cases, respondents were willing to be interviewed at the time of the consent call. In those cases, interviewers proceeded with the interview directly. The survey team called respondents at different times of the day to boost the chances of reaching them at a time when they were available to speak.
In this section, we describe the strategy we used to select respondents and provide basic information about their background. To sample respondents for this survey, we drew on an existing panel of Grade 3 and Grade 4 students (2020 academic year assignments) attending 397 schools distributed across 23 districts in 6 regions of Tanzania: Pwani, Songwe, Kigoma, Singida, Simiyu, and Tanga. We are conducting two randomised evaluations in these 397 panel schools: a) an evaluation of the Government of Tanzania’s School Quality Assurance (SQA) programme and b) an evaluation of the KiuFunza teacher incentives programme. Due to budget constraints, we could not conduct phone interviews with parents at all 397 panel schools. Therefore, we chose a random sub-sample of 200 schools, stratifying by district and treatment assignment.
Once we had selected the subset of 200 schools, we collected phone numbers for parents of all Grade 3 and Grade 4 students whom we had previously assessed at these schools in 2019 and 2020.5 The total number of students assessed at both baseline and endline in these 200 sample schools was 3,360. We restricted the sample to students who had been assessed twice to make sure that we had information on their learning gains prior to the pandemic. We obtained some parental contact information for 2,937 out of 3,360 target students. Once we had secured contact details for these students’ parents, we randomly selected five students from each grade in each school whose parents we would aim to speak with. We wanted to have a sample that was balanced by grade at the school-level. We prioritised surveying parents of these students. However, if we could not reach students on this priority list, they would be replaced with a student at their school from the same grade (provided we had contact details for another student at that school). In total, we interviewed 2,240 students across the 200 schools.
Table A.1 provides basic demographic information about our sample. More than 8 out of 10 respondents identify themselves as the head of household. The majority of our respondents are farmers and have completed primary school. Only 8 percent of parents or primary-care givers have a secondary school education. We find that only about one-third (37 percent) of our households report having regular access to electricity6 and only 54 percent own a radio. TV and computer ownership is even more limited at 17 percent and 1 percent, respectively. These resource constraints may have limited children’s ability to engage with remote learning media.
Table A.2 tests if the surveyed sample has similar characteristics relative to (i) the overall sample of students we surveyed and assessed at schools previously and (ii) the selected sample that we intended to survey but were unable to do so. We were able to survey roughly two-thirds of the selected sample. Surveyed households are wealthier and their children performed better on learning assessments, compared to households that were not surveyed. This is likely due to the fact that poorer households are less likely to own a phone, or they live in remote locations where phone connectivity is limited. This suggests that we might be over-reporting the extent of access to remote learning opportunities in the country as a whole. In all subsequent analysis of the phone survey, we partially address this concern by weighting each observation by the inverse of the expected probability of being surveyed.7
Figure 1 shows that at the time of survey, the majority of parents (93 percent) believed it was safe or extremely safe for their child to return to school. Parents’ comfort with sending their children back to school may be related to signals they received from government officials. For example, in June 2020, President John Magafuli announced that Tanzania was free from COVID-19. Moreover, almost all (99.8 percent of) parents indicated that their primary school age child was back in school.8
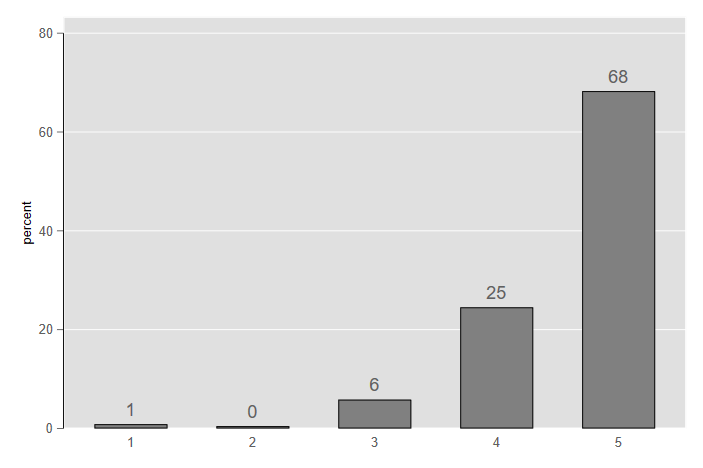
Note: n=2240. Observations are weighted by the inverse of the expected probability of being surveyed.
Figure 2 shows that few children accessed remote education lessons during the school closures. Approximately 6 percent of households report that their child listened to radio lessons during the school closures—and a similar fraction (5.5 percent) report that their child watched an educational TV programme over that period. Only 10 out of 2,240 sample households (.4 percent) report that their child accessed an educational programme on the internet. Table A.3 shows that households that own a radio (or radio phone) are 6.9 percentage points more likely to have listened to radio lessons during the closures, relative to those who do not own a radio device. The take-up of radio lessons was low even amongst households with access to a radio: only 10 percent of these households reported listening to lessons. Similarly, take-up of TV lessons was much higher in households that own a TV and have access to electricity.
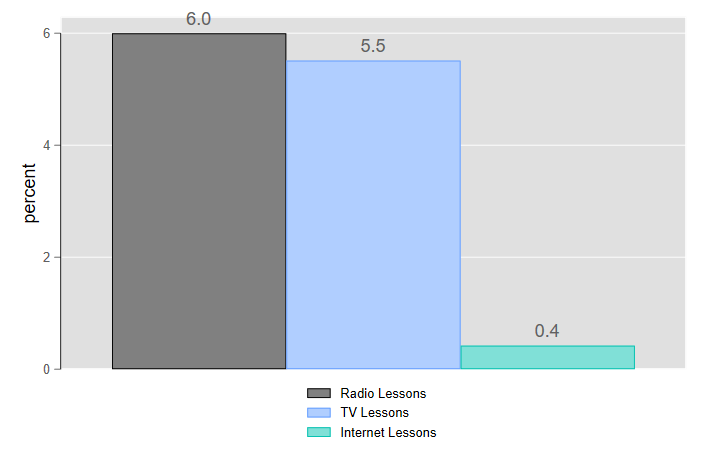
Note: n=2240. Observations are weighted by the inverse of the probability of being surveyed.
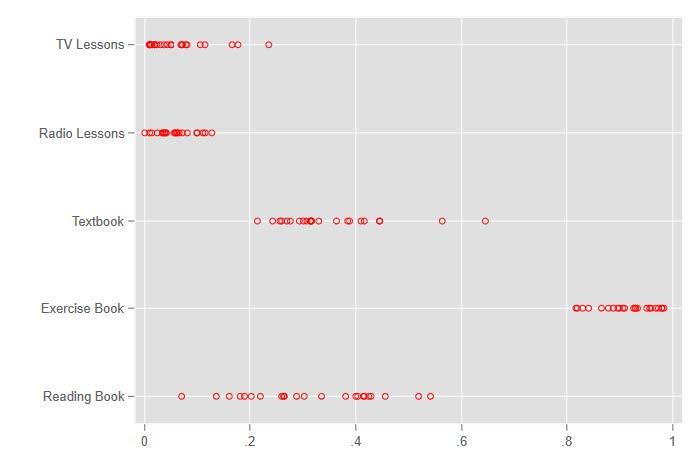
We also examine whether or not children have access to educational materials at home. Figure 3 shows that children have an exercise book and a writing utensil in more than 9 out of 10 households (92 percent). However, only 1 in 3 (35 percent) households report that their primary school age child has access to school textbooks at home, a disparity which could limit the use of the exercise book for school-related homework and practice. A similar fraction of households (31 percent) in our sample own any children’s reading books. We also ask parents whether they read to their child within the last week.
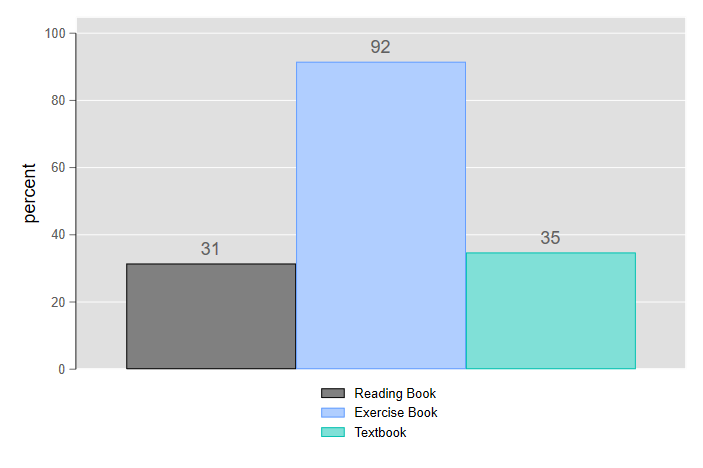
Note: n=2240. Observations are weighted by the inverse of the probability of being surveyed.
In terms of parental behaviour, Figure 4 shows that approximately 1 in 4 parents (24 percent) had read a book to their child within the last week. One fourth of parents (25 percent) report that one of their children was reading a book at the time of survey.
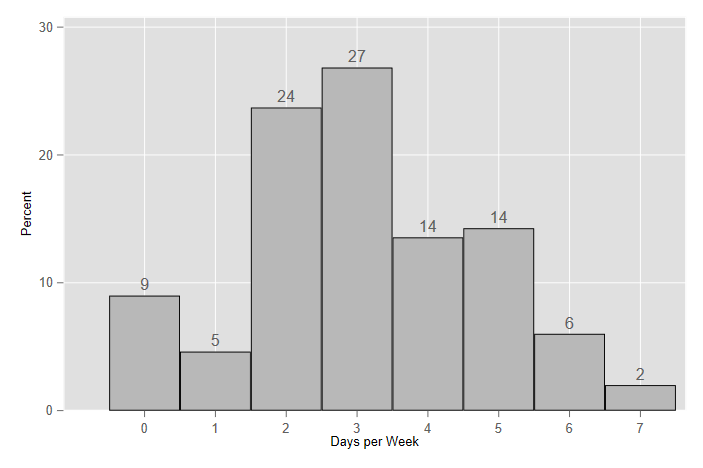
Figure 4 also shows that more than 1 in 3 children (36 percent) worked on the family farm during school closures. Far fewer children (less than 2 percent) in our sample engaged in any non-farm work over the same period. The majority of children who worked on the family farm did so worked on the either two or three days a week. There are no clear differences by gender (see Table A.4 in the appendix), except that male children are 6.2 percentage points more likely to have worked on the family farm compared to female children.
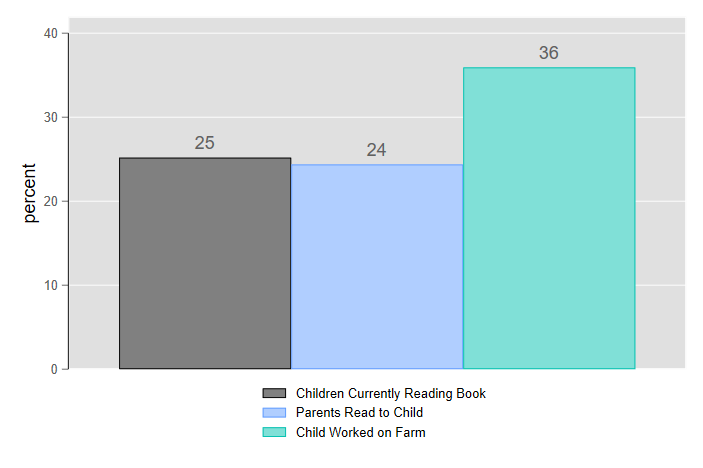
Note: n=2240. Observations are weighted by the inverse of the probability of being surveyed.
To better understand the government’s response to the school closures (in particular, support that local officials may have provided to students), we conducted qualitative interviews with 75 Ward Education Officers (WEO) in charge of 75 primary schools in December 2020. These 75 WEOs operate in the same 23 districts as our sample of parents.9 More than 8 in 10 WEOs we spoke with (84 percent) indicated that they helped students during the school closures. Many of the WEOs we spoke with cited a desire to boost exam pass rates as their primary motivation for offering support to students. In most cases, the directive to help students came from the WEOs’ bosses at the district. The most common way that WEOs supported students was to compile packages that consisted of questions/exercises and distribute them to students. Approximately 1 in 3 (29.3 percent) WEOs we surveyed prepared packages for students. They distributed packages in three ways: a) parents and children came to their local primary school to collect the packages; b) sub-village officials collected the packages and distributed them to parents; and c) WEOs left the packages at a stationery shop for parents and students to collect. Several WEOs we spoke with in two districts, Maswa and Pangani, mentioned that they organised educational radio programmes that students could tune into.
However, both the informal surveys of WEOs and our data suggest that these initiatives struggled to reach all households. To take one example, Figure 5 shows that even if we restrict the sample to households that report access to radio, the proportion of households in a district that reported listening to a radio programme varied between 0 percent in one district and 18 percent in another district (Maswa). This is also the district where the WEOs mentioned that they organised educational radio programmes.
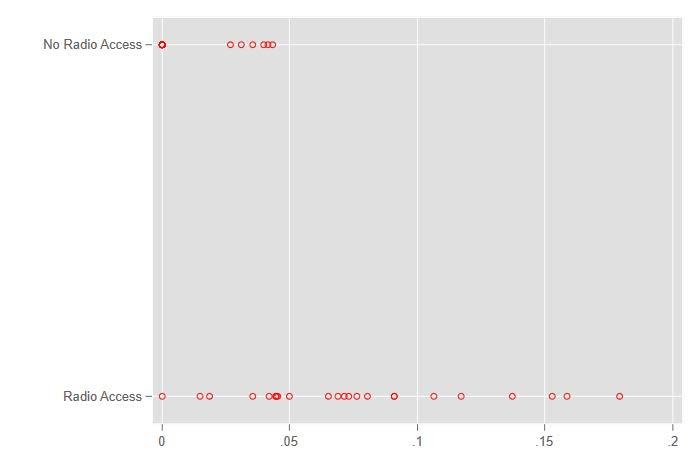
Note: n=23. Each dot represents the proportion of households in a given district who reported that a child listened to radio lessons. The top row is restricted to households that do not have access to a radio or radio phone; the bottom row is restricted to households that do have access to a radio or radio phone.
We conducted a phone survey of 2,240 parents or caregivers of students from 200 primary schools in Tanzania to learn more about parents’ decisions to send their children back to school and activities performed during the school closures. As in many other developing countries, the Government of Tanzania and civil society responded quickly to the school closures and organised TV and radio lessons. There were also decentralised government efforts to provide learning materials to households and organise radio programmes. Unlike most countries in the world, schools in Tanzania were closed for a short time period: just over three months. Our response rate was relatively high for a phone survey (67 percent) and our respondents were wealthier with higher levels of student learning compared to the sampled households that we were unable to survey.
We find that almost all children have returned to school and that students had limited access to remote learning during the school closures (only 6 percent of households reported that their children listened to radio lessons during the closures) and just over a third of households reposed that their children worked on the farm during this time. Students were more likely to listen to radio or TV lessons if the household owned a radio or TV. There are no clear gender differences, except that boys were more likely to work on the farm.
Like other governments, the Government of Tanzania adopted remote learning programmes with the goal of keeping students engaged and mitigating learning loss during school closures. This study suggests that the reach of these programmes was limited. Other developing countries have likely faced similar challenges in providing remote learning opportunities to the majority of the school population, especially for poor households in remote locations. Indeed, studies have found similarly low levels of exposure in Pakistan and Nepal.10 ,11 If this is true, then the expected learning loss due to COVID could be high in countries where the schools have remained closed for longer periods of time. Recent research underscores the threat that school closures may pose to student learning.12 ,13 Future research will attempt to estimate the size of the learning loss in Tanzania.
| Variable | Mean | Std. Dev. | Min. | Max. |
|---|---|---|---|---|
| Head of household | 0.817 | 0.387 | 0 | 1 |
| Respondent occupation - farmer | 0.746 | 0.435 | 0 | 1 |
| Respondent education - primary | 0.797 | 0.402 | 0 | 1 |
| Respondent education - secondary | 0.078 | 0.268 | 0 | 1 |
| No. primary school age children | 2.773 | 1.346 | 1 | 11 |
| No. secondary school age children | 0.44 | 0.761 | 0 | 9 |
| Access to regular electricity | 0.367 | 0.482 | 0 | 1 |
| Owns radio | 0.537 | 0.499 | 0 | 1 |
| Owns radio phone | 0.656 | 0.475 | 0 | 1 |
| Owns internet phone | 0.131 | 0.338 | 0 | 1 |
| Owns TV | 0.17 | 0.376 | 0 | 1 |
| Owns computer | 0.012 | 0.109 | 0 | 1 |
| Owns computer with internet | 0.009 | 0.096 | 0 | 1 |
| Child's gender - male | 0.493 | 0.5 | 0 | 1 |
| N=2240 | ||||
| Variable | 1 | 2 | 3 | T-test | ||||
|---|---|---|---|---|---|---|---|---|
| Surveyed | Sampled, not surveyed | Not sampled | Difference | |||||
| N | Mean/SE | N | Mean/SE | N | Mean/SE | (1)-(2) | (1)-(3) | |
| Asset index | 2240 | 0.067 (0.021) | 1106 | -0.089 (0.029) | 3325 | -0.020 (0.017) | 0.156*** | 0.087*** |
| Student learning | 2240 | 0.053 (0.021) | 1106 | -0.110 (0.032) | 3325 | -0.011 (0.017) | 0.164*** | 0.064** |
Notes: The value displayed for T-tests are the differences in the means across the groups. District fixed effects are included in all estimation regressions. ***, **, and * indicate significance at the 1, 5, and 10 percent critical level.
| (1) Radio lessons |
(2) TV lessons |
|
|---|---|---|
| Radio | 0.069*** (0.008) |
|
| Access to electricity | 0.026*** (0.008) |
|
| Own radio phone | 0.023*** (0.008) |
|
| Own radio | -0.011 (0.009) |
|
| Own TV | 0.246*** (0.023) |
|
| Constant | 0.010** (0.004) |
|
| Observations | 2240 | 2152 |
| R-squared | 0.017 | 0.231 |
Notes: Each column represents a separate regression. Standard errors are in parentheses. * for p<.1; ** for p<.05; *** for p<.01
Note: n=796 households with child who worked on farm during school closures
| Variable | 1 | 2 | T-test | ||
|---|---|---|---|---|---|
| Male | Female | P-value | |||
| N | Mean/SE | N | Mean/SE | (1)-(2) | |
| Radio lessons | 1105 | 0.059 (0.007 |
1135 | 0.061 (0.007) |
0.739 |
| TV lessons | 1105 | 0.063 (0.007) |
1135 | 0.047 (0.006) |
0.131 |
| Internet lessons | 1105 | 0.005 (0.002) |
1135 | 0.003 (0.002) |
0.552 |
| Worked on farm | 1105 | 0.391 (0.015) |
1135 | 0.329 (0.014) |
0.002*** |
| Children currently reading books | 1105 | 0.260 (0.013) |
1135 | 0.244 (0.013) |
0.743 |
| Parents read to child | 1105 | 0.244 (0.013) |
1135 | 0.244 (0.013) |
0.722 |
| Owns reading books | 1105 | 0.321 (0.014) |
1135 | 0.308 (0.014) |
0.667 |
| Has exercise book | 1105 | 0.923 (0.008) |
1135 | 0.907 (0.009) |
0.247 |
| Has textbook access | 1105 | 0.329 (0.014) |
1135 | 0.365 (0.014) |
0.067* |
Note: n=2240
The authors would like to thank Anthony Mwambanga for his contributions to this note.
Cilliers, J. and Oza, S.. 2021. What Did Children Do During School Closures? Insights from a Parent Survey in Tanzania. 2021/027. https://doi.org/10.35489/BSG-RISE-RI_2021/027