Emeka W. Nweke
Centre for the Study of the Economies of Africa (CSEA)
Insight Note


Centre for the Study of the Economies of Africa (CSEA)

Centre for the Study of the Economies of Africa (CSEA)
An important element in the RISE Nigeria project is its political economy component, which studies how politics interacts with education demand to shape education policymaking and learning outcomes. Overall, we aim to understand how demand-side issues in education such as community engagement, parental investments, student motivation, and local politics affect educational outcomes at the community level. Specifically, the political economy component demonstrates how a local experiment involving constructive dialogues between community education stakeholders and policymakers and commitments from policy actors can impact education in the Nigerian context.
Our approach considers the potential role of local politics in influencing education investments and quality of school governance through a two-stage process. The first stage involves conducting education awareness workshops that bring together stakeholders in the education sector, with the purpose of gathering information regarding education-related policy priorities. Information on stakeholder priorities is also collected at this time through a survey.
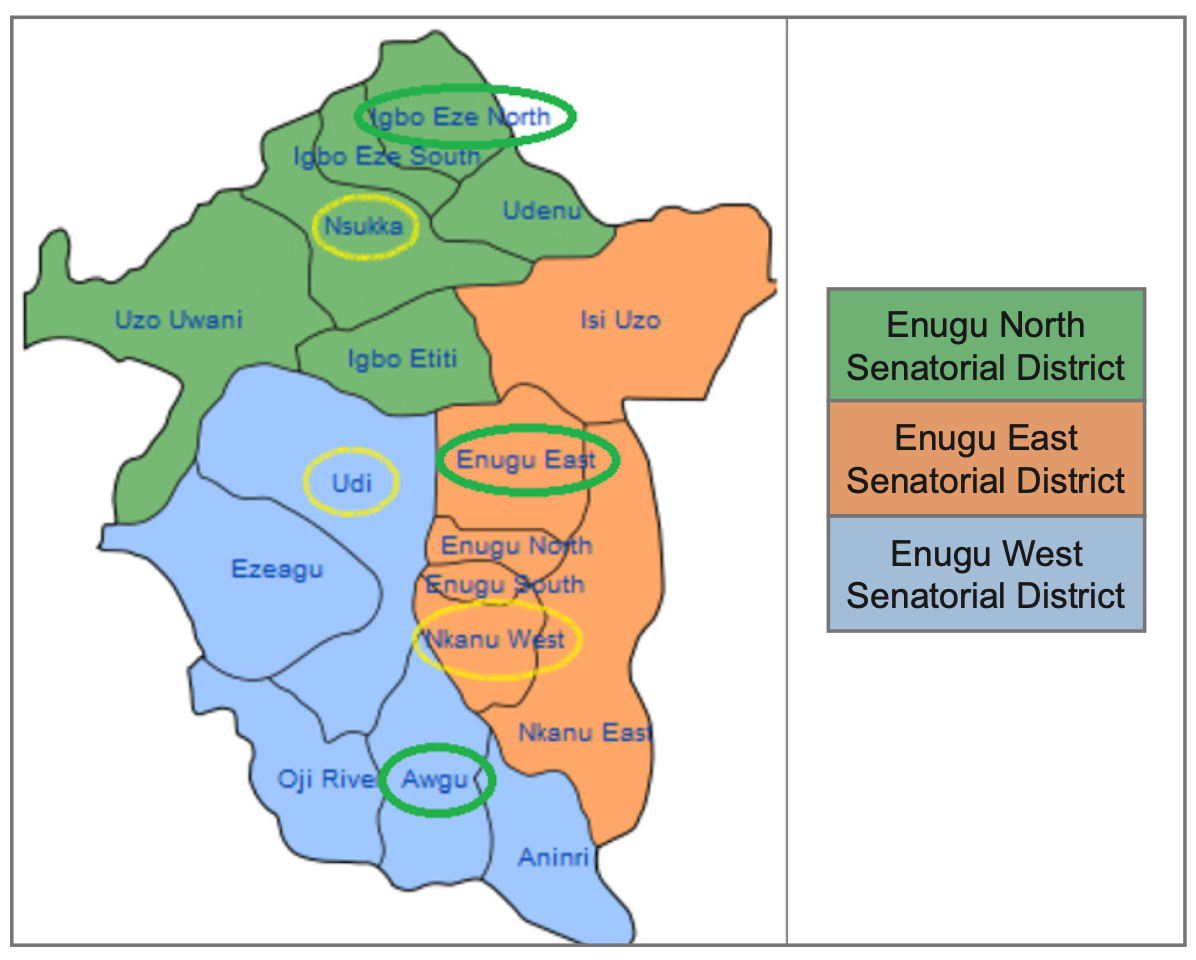
The second stage involves the development and signing of an education sector “social contract” between the government of Enugu State and education stakeholders (non-political actors) in town-hall meetings which we refer to as education summits. The education summits are central elements of the political economy study and are essential in testing the project’s theory of change concerning the role played by political engagement in improving and sustaining learning. To maximise the effectiveness and concreteness of these engagements, it is essential for discussions to be grounded in evidence surrounding the general conditions of education in the treated Local Government Areas (LGAs)—Nkanu West, Udi, and Nsukka.
Overall, we intend to answer the following research questions:
The study is motivated by the need to improve education outcomes in both Nigeria and Enugu State and the importance of education to national development. According to the United Nations (2021), education enables upward socioeconomic mobility and is a key to escaping poverty. In Enugu State, the number of out-of-school children was over 416,000 in 2014 (Education Sector Support Programme in Nigeria, 2014). The majority of out-of-school children were male. While educational reforms are being implemented, there are still significant deficits in educational administration in the state and in Nigeria in general. This has resulted in poor education outcomes across all facets of education.
The theoretical background for the study lies in John Rawls’ ideas about a well-ordered constitutional democracy (1997). In this theory, deliberation is key to positive outcomes. Other scholars (Gutmann and Thompson, 2004) have also found deliberation to be important in conflict resolution. We believe that education could be improved through better policy if policymakers consulted education stakeholders in deliberative processes.
In this insight note, we describe the experimental design of the political economy project in Enugu State and provide data on stakeholder priorities and school infrastructure quality within the state. Pre-summit survey activities indicated that access to education, quality of education, and financial management are the top three priorities for community-level education stakeholders in Enugu. They also show that school infrastructures such as electricity, access, toilets, and physical building maintenance are lacking.
The experiment is designed to understand the interplay between local political engagement and educational outcomes. In the following sections, we describe the rationale for selecting states, the choice of intervention, the selection and assignment of samples, and how the intervention is implemented.
There are six geopolitical zones in Nigeria—South-south, South-east, South-west, North-east, North-west, and North- central. With the exception of states from the North-central zone, the RISE Country Research Team (CRT) randomly selected one state from each of the geopolitical zones. Hence, five states were randomly selected from 36 across Nigeria—Enugu, Oyo, Jigawa, Bauchi, and Delta States.
Nigerian states are categorised into three senatorial districts, which are further divided into local government areas (LGAs). We randomly selected two LGAs from each senatorial district for a total of six LGAs to be sampled in Enugu State. The selected LGAs consist of three treated and three control LGAs. The baseline survey involved collecting data from communities in three stages: firstly, a priority survey; secondly, a school and student evaluation survey; and finally, a standardised test for students.
The sampling protocol describes the strategy used in selecting respondents across LGAs for both the treatment and control groups. Prior to the commencement of data collection, we acquired a comprehensive list of all public-primary schools in each selected LGA. From this list, we randomly selected 10 schools to receive the school and student survey and to be used as a reference point to access members of the host community. Table 1 shows the sample size across the various surveys conducted. Three surveys were conducted in total: a stakeholder priority survey administered to influential community members, a school evaluation survey involving direct observation of schools by the RISE Nigeria Team, and a standardised test administered to students within selected schools.
| LGAs | Category | Sample Size | ||
|---|---|---|---|---|
| Stakeholder Priority | School Evaluation | Standardized Test | ||
| Udi | Treated | 211 | 10 | 311 |
| Nsukka | Treated | 180 | 10 | 303 |
| Nkanu West | Treated | 199 | 10 | 350 |
| Igbo-eze North | Non-Treated | - | 10 | 367 |
| Awgu | Non-Treated | - | 10 | 378 |
| Enugu East | Non-Treated | - | 10 | 285 |
For each of the 10 schools, the team sampled pupils in primary Grade 5 and primary Grade 6, head teachers, three class teachers, and parents. The student and school evaluation surveys were conducted in both treatment and control LGAs. Table 2 highlights key questions that were asked in this survey.
| Level | Questions | Code | Options |
|---|---|---|---|
| School | 1. Are there toilets for the student in the school? | Toilet Facilities | 0 = Yes 1 = No 99 = Don’t Know |
| 2. Does the school have a sign post at the entrance? | Sign at Entrance | 0 = Yes 1 = No 99 = Don’t Know |
|
| 3. Does the school have an outdoor courtyard/garden suitable for recreation? | Courtyard | 0 = Yes 1 = No 99 = Don’t Know |
|
| 4. Are the windows visible in the school building? | Windows | 0 = Yes 1 = No 99 = Don’t Know |
|
| 5. Are the school premises surrounded by a gate/wall? | Gate/Wall | 0 = Yes 1 = No 99 = Don’t Know |
|
| Classroom | 6. Is there a leaking roof in the classroom? | Leaking Roof | 0 = Yes 1 = No 99 = Don’t Know |
| 7. Is there a window in the classroom? | Window | 0 = Yes 1 = No 99 = Don’t Know |
|
| 8. Is there a fan in the classroom? | Fan | 0 = Yes 1 = No 99 = Don’t Know |
|
| 9. Is there a WORKING lightbulb in the classroom? | Working Lightbulb | 0 = Yes 1 = No 99 = Don’t Know |
|
| 10. Does the classroom have any access to electricity? | Electricity | 0 = Yes 1 = No 99 = Don’t Know |
|
| 11. Are there desks in the classroom? | Desk | 0 = Yes 1 = No 99 = Don’t Know |
|
| 12. Are there chairs for every desk in the classroom? | Chair | 0 = Yes 1 = No 99 = Don’t Know |
|
| 13. Is there a chalkboard or other board at the front? | Chalkboard | 0 = Yes 1 = No 99 = Don’t Know |
|
| 14. Are there chalks/pens to write on the board? | Pens/Chalk | 0 = Yes 1 = No 99 = Don’t Know |
Once we had selected 10 schools as mentioned above, to sample respondents for the priority survey, we relied on local residents who lived within the sampled schools’ area. We prioritised surveying distinguished locals or individuals who ‘call the shots’ in these communities. The local indigenes consisted of religious and community leaders, parents, and others with high status. After identifying respondents to be interviewed, questionnaires were administered either face-to-face or through focus group discussions. Table 3 presents an overview of education stakeholder priorities and their sub-issues.
| Priorities | Sub-issues |
|---|---|
| Access to Education | Shortages of infrastructure and teachers |
| Low retention and completion rates | |
| Lack of effective school feeding programs for students | |
| Inadequate sanitation and hygienic facilities | |
| Insecurity (terrorism, militancy, cultism) | |
| Quality of Education | High student-teacher ratio |
| Poor quality of facilities and furniture | |
| Poor quality of teachers | |
| Poor quality curriculums | |
| Teaching poorly targeted to the job market | |
| The need to improve exam scores of students | |
| Financial Management | Insufficient spending on the education sector |
| Misallocation of public funds for education | |
| Inefficient financing of education; high reliance on state spending | |
| Lack of a tracking mechanism for education expenditure | |
| Insufficient investment in private education | |
| Financial insecurity and lack of professional development for teachers | |
| Governance of the education sector | Poor maintenance of school buildings and facilities |
| Lack of transparency in staff training and hiring | |
| Inefficiency in school management and organisation | |
| Absence of a holistic approach to education policy that integrates other aspects of social life (economic, health, etc.) | |
| Absence of a multi-stakeholder platform that can oversee and contribute to school management | |
| Teacher formation and regulation | Recruitment of qualified teachers |
| Retention of qualified teachers | |
| Teacher incentives and pensions | |
| Effective evaluation of teacher abilities and clear promotion index | |
| Teacher absenteeism | |
| Stakeholder engagement | Parents |
| Religious Authorities | |
| Community | |
| School Board Management Committee | |
| Local Authorities |
In coding the questionnaires, levels of priority ranged from 0–5. The most prioritised education issues were coded “0” while the least prioritised issues were coded “5”.
The third survey instrument administered was a standardised test—used as a proxy to understand learning outcomes. The CRT designed the test to align with the curriculums of pupils in primary Grades 5 and 6. To sample pupils for this survey, priority was given to pupils in Grade 6; however, in cases where the class size was less than the required sample
size, pupils in Grade 5 were used to augment the shortfall. The test, which covered four core subjects (mathematics, English language, basic science, and social studies), was aimed at measuring numeracy and literacy skills, as well as basic knowledge of social studies. The standardised test had 100 questions (25 for each subject) and each pupil was allotted two hours to complete the test under the invigilation of both the class teacher and a CRT member.
Figure 2 depicts the theory of change approach in assessing the interplay of policy deliberation and education outcomes. The CRT utilised three stages in carrying out this strategy: pre-summit, summit, and post-summit monitoring.
The pre-summit stage included designing questionnaires, testing instruments, and data collection—all of which informed discussions and activities for the education summit. The goals of the pre-summit stage were to identify pressing issues affecting education at the community level, engage with local-relevant indigenes, and understand the state of schools in selected treated communities: Nsukka, Nkanu west, and Udi LGAs.
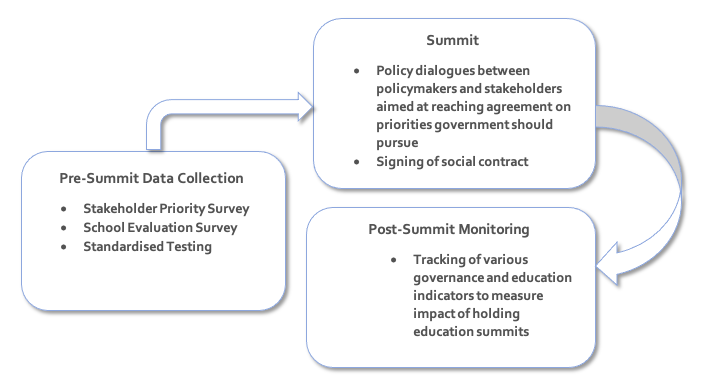
Source: RISE Nigeria Country Research Team (CRT) 2021
The education summit intervention is the central element of the study. According to the theory of change, the education summit will improve and sustain learning outcomes by filling existing knowledge gaps in the education system. In other words, dialogue between political actors and other education stakeholders leading to social contracts is a tool towards achieving improved learning outcomes. Education summits were held across the three treated LGAs. Participants included top state-level government representatives, civil society organisations, religious and community leaders, parents, teachers, and others.
Prior to the commencement of the summit, we administered an attitudinal survey to gauge the expectations of summit participants ‘before’ and ‘after’ the summit event. The survey was administered to all participants at the summit event to evaluate the effectiveness of the summit.
A principal component of the summit event was the presentation of activities from the pre-summit (data collection) stage. Here, a member of the RISE Nigeria Team introduced the political economy project to the participants to enable attendees to get acquainted with outcomes of pre-summit data collection and facilitate a constructive dialogue between political and non-political actors in education. Deliberations and discussions were also guided by the evidence gathered during pre-summit activities. Reports were presented on the current conditions of classrooms and learning environments, pressing or urgent needs and priorities of the LGAs with regards to basic education, and performance of pupils on standardised tests.
Participants were urged to validate or criticise outcomes, to provide a personal account of events happening in their communities regarding basic education, and to proffer solutions for how the government could intervene in improving the state of basic education. After each participant made their contribution, the government representative reacted to the issues raised.
Following this deliberation, key outcomes from the constructive dialogue were presented and read out loud to all attendees. The social contract was then drafted and notarised by representatives of different interest groups.
When presented with the option of eliciting urgent education issues in order of preference, education stakeholders preferred quality of education as requiring urgent attention in Enugu State. This preference was followed by access and funding of the education sector, while governance in the education sector, stakeholder engagement, and teachers’ formation (training and all other activities that lead to high-performing teachers) and regulation in the education sector were the least preferred. However, the individual treatment LGAs had slight differences in preference. Access to education was the highest priority in Udi and Nsukka LGAs, while quality of education was the most prioritised issue in Nkanu West LGA (see Table 4).
| Priorities | Udi | Nsukka | Nkanu West | Total |
| Access to Education | 1.133*** | 0.932*** | 1.576* | 1.286 |
| (0.965) | (0.998) | (1.257) | (1.141) | |
| Quality of Education | 1.317** | 1.386* | 0.941*** | 1.164 |
| (1.033) | (0.945) | (1.016) | (1.021) | |
| Funding the Education Sector | 1.650* | 1.136** | 1.106** | 1.286 |
| (1.102) | (1.047) | (0.900) | (1.028) | |
| Governance in the Education Sector | 1.917 | 2.545 | 2.624 | 2.381 |
| (1.253) | (0.730) | (0.831) | (1.012) | |
| Teachers’ Formation and Regulation in the Education Sector | 4.800 | 4.250 | 4.412 | 4.497 |
| (0.403) | (0.438) | (0.660) | (0.580) | |
| Stakeholder Engagement | 4.200 | 4.750 | 4.388 | 4.413 |
| (0.403) | (0.438) | (0.773) | (0.635) |
Note: The coefficients are mean values (0 -5, with 0 being highly preferred and 5 less preferred). The top three priorities are marked with *;**;***, with *** being the highest priority according to stakeholders. Standard deviations are in parenthesis.
The summit deliberation focused on the most preferred three priorities from pre-summit surveys and deliberations were structured around them. The several sub-issues that make up these priorities added details to how the summit dialogues were structured. For instance, summit participants in Udi were required to describe issues leading to poor access to education, quality of education, and funding of the education sector in that order. They were also required to propose possible solutions. This same approach was replicated across the three LGAs as issues to be deliberated upon were discussed in the order of preference. This strategy was aimed at ensuring a constructive deliberation at each summit. Summit participants were given the opportunity to back up survey findings by making tangible demands towards improving the identified education priorities.
The state of school infrastructure and education needs across treatment and control LGAs provided the study with a basis for comparison before and after the summit. Will the summit outcome spur any changes in the learning outcomes of schools within treatment LGAs? How will the summit effect on treatment LGAs cause learning outcomes to differ when compared to those in the control LGAs? Table 5 summarises the current state of selected school infrastructures.
“Chalkboard” denotes the presence of a chalkboard in each of the classrooms surveyed. Results show a 65 percent presence in the control schools and 77 percent in the treatment group. Despite a seemingly-adequate presence of chalkboards across treatment and control LGAs, results show a high inadequacy of “Pens/Chalk” in both treatment and control LGAs. This implies that even though schools are equipped with chalkboards, they do not have adequate teaching and writing materials. The current state of school infrastructure seems similar across treatment and control LGAs in the cases of “Desk”, “Working Light Bulb”, “Fan” and “Leaking Roof”.
| Variable | Control | Treatment | Total |
|---|---|---|---|
| Chalkboard | 0.656 | 0.770 | 0.722 |
| (0.433) | (0.400) | (0.415) | |
| Pens/Chalk | 0.067 | 0.111 | 0.093 |
| (0.203) | (0.387) | (0.322) | |
| Desk | 0.544 | 0.524 | 0.532 |
| (0.442) | (0.449) | (0.443) | |
| Chairs | 0.189 | 0.254 | 0.227 |
| (0.358) | (0.402) | (0.383) | |
| Electricity | 0.056 | 0.032 | 0.042 |
| (0.177) | (0.123) | (0.147) | |
| Working Light Bulb | 0.022 | 0.024 | 0.023 |
| (0.122) | (0.114) | (0.116) | |
| Window | 0.689 | 0.817 | 0.764 |
| (0.371) | (0.354) | (0.364) | |
| Fan | 0.044 | 0.040 | 0.042 |
| (0.115) | (0.151) | (0.136) | |
| Leaking Roof | 0.767 | 0.738 | 0.750 |
| (0.317) | (0.365) | (0.343) |
Note: The coefficients are percentage value showing the degree of presence or lack of infrastructure. Standard deviations are in parenthesis.
The results in Table 5 show that key electrical infrastructures including “Electricity”, “Fan” and “Working Light Bulb” are inadequate across both treatment and control LGAs. This implies an urgent need to provide access to electricity in schools. Similarly, access to classroom chairs denoted by “Chairs” implies that the chair to desk ratio in classrooms is very poor across treatment and control LGAs. Lastly, results show that about 75 percent of classrooms have leaking roofs in both treatment and control LGAs, indicating a poor level of maintenance of schools’ physical infrastructures.
While Table 5 describes conditions of school infrastructure at the classroom level, Table 6 focuses on conditions at the school level. The presence of “Gate/Wall” indicates how secure the school environment is. Schools were found to be poorly secured across treatment and control LGAs, as the absence of fencing implies that school infrastructure is poorly guarded from public and unauthorised use. Conversations with community members provided further evidence that security is an issue—schools surveyed in Enugu were observed to be serving an academic purpose in daytime and unauthorised non-academic purposes at night, with community members loitering on the school premises. Schools being used for illicit activities outside of school hours is a common issue in Nigeria.
The presence of “Sign at the entrance” helps capture the level of local awareness of the presence of school(s) in the community. Results show that 72 percent of the schools surveyed had a visible sign at the entrance. The presence of a “Courtyard” implies that the school is better able to balance academic and extra-curricular activities. About 80 percent of schools surveyed were found to have well-sized courtyards in both control and treatment LGAs. Results also showed that across treatment and control LGAs, schools surveyed in Enugu had proper ventilation. Children are better able to receive education in well-ventilated classrooms and administrative blocks.
However, results show a poor availability of working toilets and access to clean drinking water in public primary schools in Enugu. This condition is denoted by the variable “Toilet”. Only 16 percent of schools surveyed across treatment and control LGAs were found to have toilet facilities and in most cases, these were latrines (otherwise known as pit toilets).
| Variable | Control | Treatment | Total |
|---|---|---|---|
| Gate/Wall | 0.133 | 0.143 | 0.139 |
| (0.346) | (0.354) | (0.348) | |
| Sign at Entrance | 0.867 | 0.619 | 0.722 |
| (0.346) | (0.492) | (0.451) | |
| Courtyard | 0.800 | 0.810 | 0.806 |
| (0.407) | (0.397) | (0.399) | |
| Windows | 0.733 | 0.833 | 0.792 |
| (0.450) | (0.377) | (0.409) | |
| Toilet | 0.200 | 0.143 | 0.167 |
| (0.407) | (0.354) | (0.375) |
Standardised tests were also administered across treatment and control LGAs to measure student performance. Results show that on the aggregate, pupils from the treatment LGAs performed better than those in the control LGAs (see Table 7), though this was not the case for all subjects. Each of the subjects were scored out of 25 to give a total of 100 acrossfour subjects—math, English, science and civic studies.
While “science” captures the level of students’ knowledge of the biotic environment, “civic studies” capture their knowledge of the abiotic environment. Results show that students performed better in knowing their biotic environment compared to the abiotic. However, the difference in scores between the two subjects was small. On the other hand, results show that most students in Enugu performed better in literacy than in quantitative skills. “Maths” was used to denote quantitative skills whereas “English” denoted literacy skills.
Outcomes from standardised testing indicate that the treatment group performed better in civic studies and social sciences, that is, differences in means are positive and statistically significant. Treatment LGAs also scored higher in English, though the result was not statistically significant. Control LGAs performed better in math, though this result was also not statistically significant from zero. Overall, these results suggest that treatment LGAs have, on average, slightly better-performing students than control LGAs.
We expect that our results on school facilities and test results are linked–that is, better facilities should result in better student performance. We intend to explore this relationship in future analyses of the PE project data.
| Variable | Control | Treatment | Treat - Control |
|---|---|---|---|
| Total | 52.01 | 54.57 | 2.565* [0.0061] |
| (18.31) | (17.53) | ||
| Science | 13.54 | 14.39 | 0.849* [0.0044] |
| (5.696) | (5.812) | ||
| Maths | 12.15 | 11.90 | -0.244 [0.3439] |
| (5.10) | (4.811) | ||
| English | 14.39 | 14.79 | 0.398 [0.1249] |
| (5.147) | (4.815) | ||
| Civic Studies | 1 | 13.59 | 1.614* [0.000] |
| (5.350) | (4.99) |
Note: The coefficients are mean values of the test scores for the different subjects. Each subject is worth 25 points. Standard deviations are in parenthesis. Probability values are in square bracket. * represents statistical significance at the 1% level.
Summit events were held in three LGAs in the first week of December 2020. Since then, summit outcomes captured by a social contract have formed the basis for repeated engagement with policy actors in Enugu State. Figure 1 in the appendix shows that summit events were able to spur the government into committing to give attention to education needs in the treated LGAs. As part of the engagement with policy actors, a workplan as shown in Figure 2 in the Appendix is being implemented to engage at a more specific level. Activities to be carried out were informed by the social contracts as shown in Figure 3 in the appendix. The appendix also includes documentation of the entire process leading from data collection to summit events. It is expected that in disseminating this documentation, parental involvement, community participation, and student motivation will be stimulated in the treatment LGAs.
Additional events will be held in treatment LGAs in Enugu in spring 2022 to disseminate the results of the education summits and further interactions with government officials. Following this, the team will collect final data to determine whether the deliberative discussions held at the education summits impacted stakeholder attitudes, government actions, and/or education outcomes in Enugu. We are hopeful that the deliberative discussions held in Enugu State can form a model for policy innovation in Nigeria.
Education Sector Support Programme in Nigeria. 2014. ESSPIN briefing note 2014 Survey Report. 2014 (Out-of-School Children in Enugu State). [online] Available at: https://www.esspin.org/esspin-documentation/briefing-notes/Briefing note-Out of School Children in Enugu.pdf
Gutmann, A. and Thompson, D. 2004. 1. What Deliberative Democracy Means. Why Deliberative Democracy?. Princeton: Princeton University Press, pp. 1-63. https://doi.org/10.1515/9781400826339-002
Rawls, J. 1997. The Idea of Public Reason Revisited. The University of Chicago Law Review, Vol. 64, No. 3.Available at: https://chicagounbound.uchicago.edu/cgi/viewcontent.cgi?article=5633&context=uclrev
United Nations Sustainable Development. 2021. United Nations Sustainable Development Goals - Education. [online] Available at: https://www.un.org/sustainabledevelopment/education/
For appendix documents, please see the PDF version of the Insight Note.
Nweke, E.W., Ogwuike, C.O., and Iheonu, C. 2022. Policy Deliberation, Social Contracts and Education Outcomes: Experimental Evidence from Enugu State Nigeria. RISE Insight Series. 2022/037. https://doi.org/10.35489/BSG-RISE- RI_2022/037