Jason Silberstein
Blavatnik School of Government, University of Oxford
Insight Note

Learning profiles have the potential to change how people think about learning. Part of their power comes from their simplicity: learning profiles are line graphs tracing out how much children know and which skills they acquire over time in a particular context. However, analysed in the right way, learning profiles can help us answer urgent questions about the learning crisis and what will—and will not—redress it. How much do children learn each year in school? When do they begin to fall behind? If every child finished lower secondary school, how much more would they learn? What if girls received just as much schooling as boys and learned just as much during their years in school? These are the kinds of questions that learning profiles can answer, as demonstrated below.
In recent years, research from across RISE has analysed learning profiles in more than 50 countries based on assessments of more than 6 million individuals.1 This Insight applies many of the methods pioneered in this literature and tests its most important conclusions against a vast new dataset: MICS6.
The sixth round of UNICEF’s Multiple Indicator Cluster Surveys (MICS6) is exciting for a few reasons. It is the first round of the survey to measure the foundational literacy and numeracy skills of children, and it has been specifically designed to align with SDG 4.1.1. It samples children ages 7-14, allowing us to directly observe how children’s foundational skills change over time from the early years of primary through lower secondary school. It is a household survey, meaning that it covers both children who are in school and those who have dropped out or never attended. It also allows for comparisons between a large number of countries: as shown in Figure 1, over 60 countries or regions are expected to eventually release data from MICS6 between 2017-2022, including many geographies not previously studied using learning profiles.
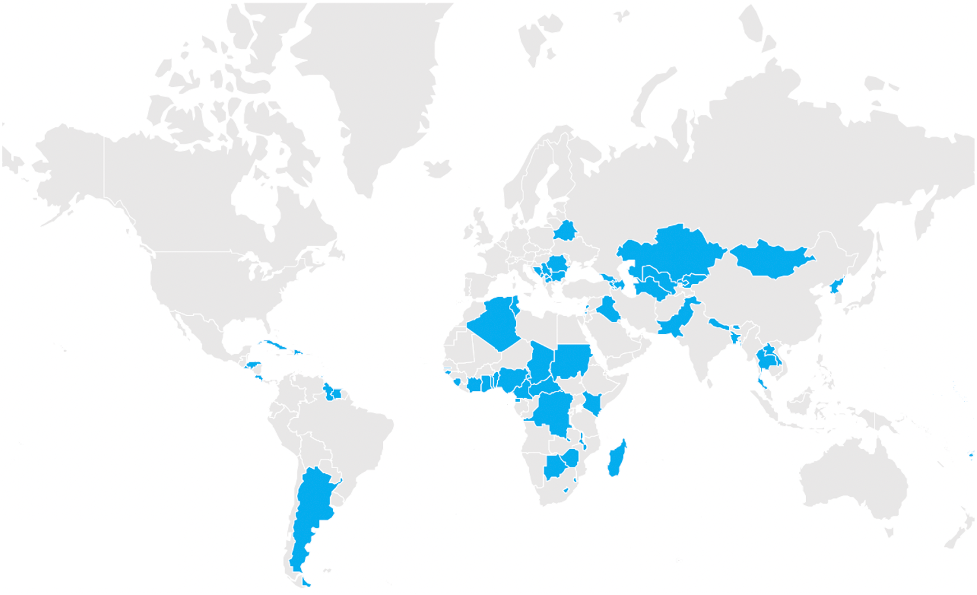
Source: UNICEF (2020)
For all these reasons, MICS6 provides information beyond what is found in typical cross-sectional national, regional, and international assessments (Kaffenberger, 2019), making it is a promising dataset for creating and analysing learning profiles. This Insight is based on learning profiles constructed from publicly available MICS6 surveys from 18 countries or regions2 which collectively assessed about 120,000 children. So, what can we learn from MICS6 learning profiles?
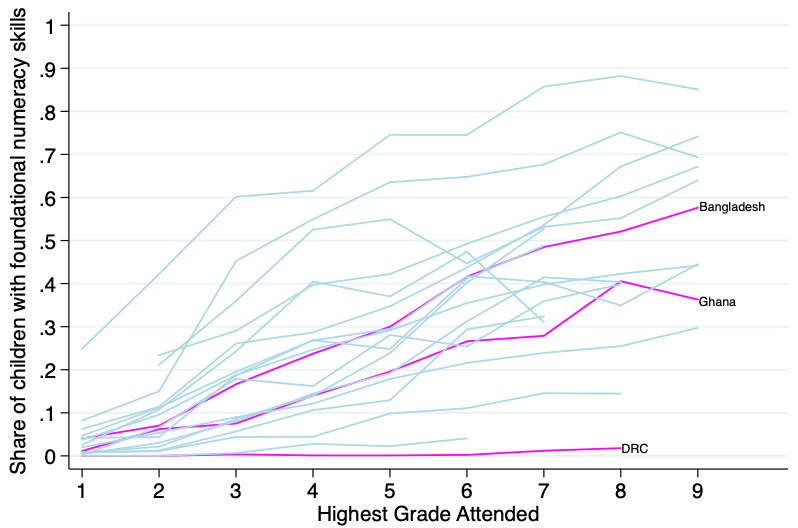
The learning profiles in Figures 2 and 3 show how children gain foundational literacy and numeracy skills as they progress through school. To arrive at these figures, I constructed thresholds for “literate” or “numerate” following UNICEF definitions calibrated to SDG 4.1.1 (UNICEF 2020). A child is literate if they can read 90 percent of the words in a simple 70-80 word story (i.e., “Musa is in class two.”), and then answer 5 questions about the story (i.e., “What class is Musa in?”). A child is numerate if they can answer 21 simple questions that ask them to identify numbers, determine which of two numbers is larger, perform basic 1- and 2-digit addition (i.e., 12+24 as a difficult example), and recognise number patterns (i.e., 2, 4, 6, _ ).
On one hand, these are low-bar thresholds in that they test only foundational skills, things that every child should be able to do. On the other hand, these thresholds leave little room for error—a child who can only read 85 percent of words correctly or who gets one math question wrong fails the test (further work is needed to check the sensitivity of the threshold). These thresholds are best thought of as measuring whether a child has mastery of foundational skills.
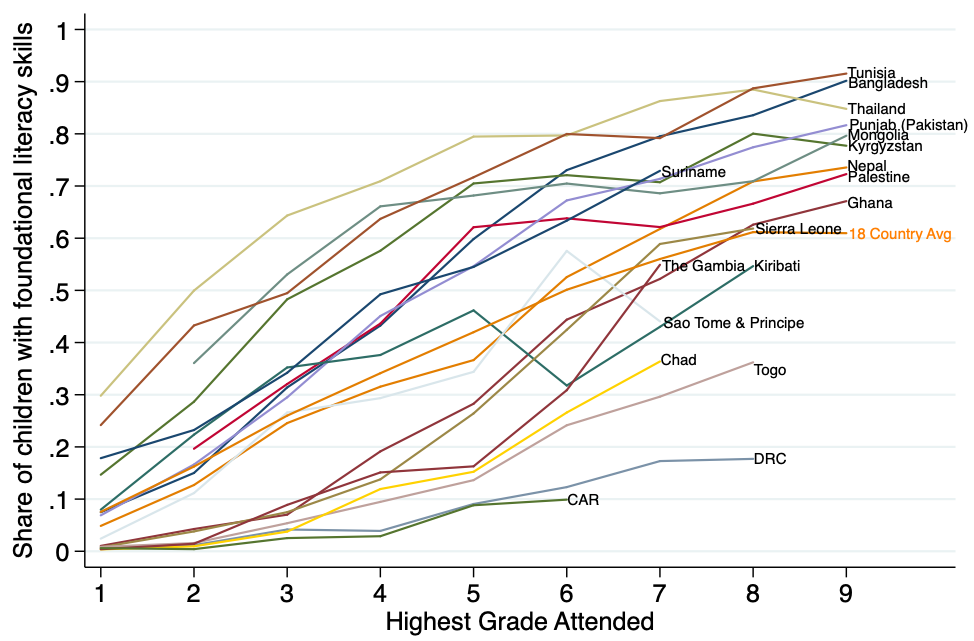
Source: Author’s calculations with UNICEF MICS6 data (Note: Some country profiles stop before Grade 9 where there were too few observations)
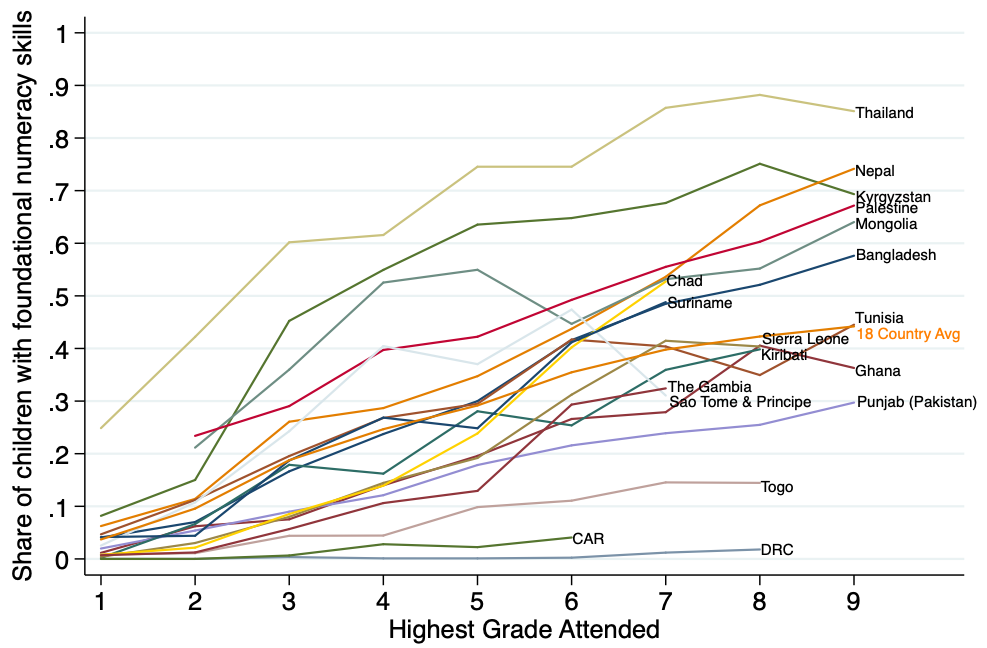
Source: Author’s calculations with UNICEF MICS6 data (Note: Some country profiles stop before Grade 9 where there were too few observations)
There are two striking features of these graphs. The first is that many of the learning profiles are relatively flat. In these countries, most students are not learning enough each year to gain low-bar foundational skills and meet SDG 4. There are only four countries in which more than half of children are meeting the SDG goals of foundational literacy by the end of Grade 3 (their highest grade attended is Grade 4), and only three countries where half of the children are numerate by the end of Grade 3. Moreover, these descriptive learning profiles likely overestimate the causal relationship between schooling and learning since they exclude children who never attended school and are probably biased upward in higher grades where many lower-performing children have dropped out.3
Second, there is astonishing variation in learning between countries. Among students who have finished primary school (their highest grade attended is 7), literacy varies from over 80 percent in high-performing countries like Bangladesh to less than 20 percent in low-performing countries like the DRC. There is a dire learning crisis in many countries—but other countries at a similar level of development have successfully created education systems that impart foundational skills to most children. The challenge that low-performing countries face is not impossible, but they need to prioritise foundational literacy and numeracy and reorient their education systems to deliver them (Belafi, Hwa, and Kaffenberger, 2020).
Where most assessments measure learning at one point in time, and often late in the schooling cycle, learning profiles show the process of learning as children progress through school. From Figures 4 and 5, it is clear that differences between countries emerge in the early years of school. While children in the three example countries have relatively similar mastery of foundational numeracy in the early grades, big gaps quickly open up between them and grow over time.
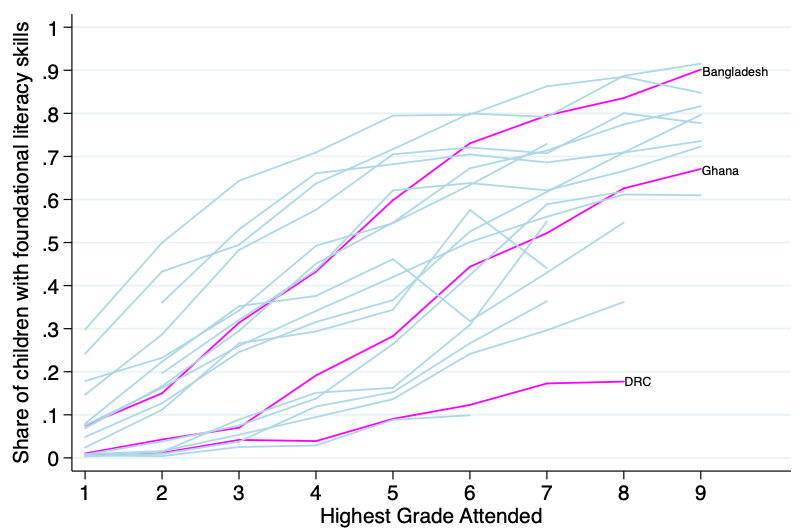
Source: Author’s calculations with UNICEF MICS6 data (Note: Some country profiles stop before Grade 9 where there were too few observations)
Source: Author’s calculations with UNICEF MICS6 data (Note: Some country profiles stop before Grade 9 where there were too few observations)
This pattern illustrates the cumulative nature of learning and the importance of closing learning gaps early on. It is more effective to intervene in earlier grades since the benefits compound over time (Kaffenberger, 2020; Das, Daniels, and Andrabi, 2020) and this can set a country (or individual child) on a steeper overall path: you can’t fix Grade 9 in Grade 8 (Chiplunkar, Dhar, and Nagesh, 2020).
This same pattern—of learning gaps emerging early and persisting through school—also holds true within countries and even inside classrooms. The bubble chart in Figure 6 provides a rough picture of the distribution of student learning levels within each grade. It groups students by the percentage of words they read correctly in the MICS6 story, and averages across all 18 countries in the data.
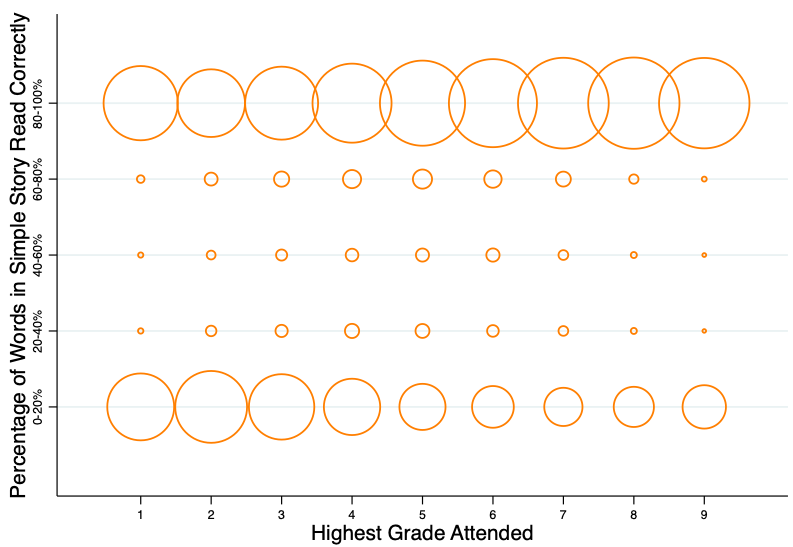
Source: Author’s calculations with UNICEF MICS6 data
Two points jump out from this graph. First, the data reflect a large literature on the wide spread in student learning levels within each grade (Muralidharan, Singh, and Ganimian, 2019), and this variation is present from Grade 1.4 Second, this pattern persists through Grade 9, meaning that there are a significant number of children in later grades that still cannot read a meaningful percentage of a Grade 2-3 level story. Once children fall behind, many remain in school and learn little, or drop out altogether. This points to the importance of aligning the level of instruction with children’s learning levels (Hwa, Kaffenberger, and Silberstein, 2020) either by reorienting curricula to match the rate at which children learn (Kaffenberger and Pritchett, 2021) or through changes to other instructional components (i.e., teaching and learning materials, pedagogy, and assessments).
Learning profiles can also be used to simulate the potential impact on learning of many common education reform agendas being pursued today. For instance, because learning profiles link schooling and learning, they are well-suited to asking how much an access and attainment agenda could be expected to deliver in terms of additional learning. To investigate this question across the range of countries in the data, I selected four example countries that are all low or lower-middle income and which represent the four possible cases defined by Table 1 below.
| Flat learning profile | Steep(er) learning profile | |
|---|---|---|
| Low baseline enrolment | Democratic Republic of the Congo | Sierra Leone |
| High baseline enrolment | Ghana | Bangladesh |
Following the methodology used by other RISE researchers—applied previously to Demographic and Health Survey data (Pritchett and Sandefur, 2020) and Financial Inclusion Insights data (Kaffenberger and Pritchett, 2020)—it is then possible to simulate how much more we could expect kids to learn if they all stayed in school until age 13 or 14. In other words, what if all kids who never went to school, or who dropped out, instead stayed in school and learned as much as the in-school kids their age do right now? This counterfactual approximates the push for universal lower-secondary school that is currently underway in many countries.
In Figure 7, the gains to foundational literacy from this agenda are represented by going from the blue to the orange bar. This is almost certainly an overestimate since it assumes out-of-school children would perform as well as those in school—when they usually perform significantly worse (Kaffenberger, Sobol, and Spindelman, 2021)—and also assumes that education systems have the capacity to expand at constant quality.
It is also possible to contrast the potential impact of an access agenda with that of a learning agenda. What if each kid spent exactly as many years in school as they do now, but they learned more each year, as much as kids in Bangladesh do (in other words, each country maintained its current attainment profile but had the learning profile of Bangladesh)? The choice of Bangladesh is arbitrary, but it makes sense as an aspirational-yet-realistic target. Bangladesh achieves the highest literacy in Grade 9 of any LMIC in the dataset, but is not an outlier in terms of GDP or expenditure on education. The plausible impact of this learning agenda is represented by the grey bars in Figure 7.
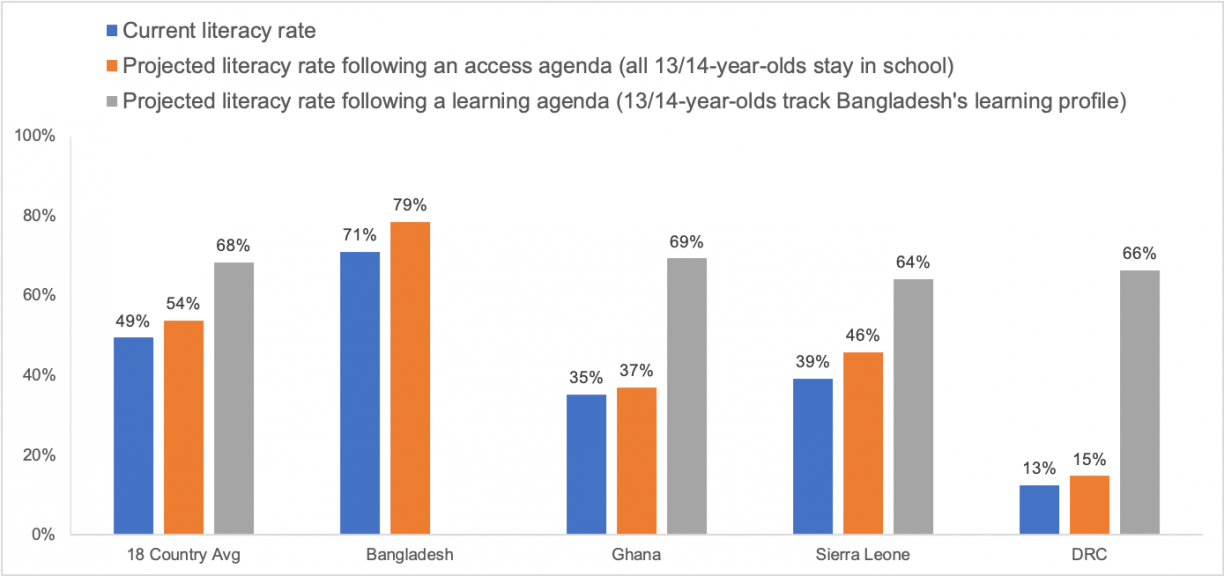
Source: Author’s calculations using UNICEF MICS6 data
This simulation reveals the limits of an access agenda. The gains would be very modest in countries where most kids are already in school (Bangladesh, Ghana), or where being in school doesn’t teach you that much (DRC). For the average country in the dataset, universal lower secondary might increase learning by around 5 percentage points, or a little less than 1/10 of the gap to universal foundational literacy (SDG 4.1.1.). Going to and staying in school still leaves most countries a long way from achieving learning goals. Sierra Leone represents the asterisk to this conclusion. In Sierra Leone, an access agenda might yield more learning since there are many kids out of school, and the learning profile for those in school is relatively steep. This variation among the example countries underscores the need to build and analyse learning profiles at the country (or subnational) level.
If countries instead prioritised a realistic learning agenda, and were able to transform their education systems to deliver as much learning per year as Bangladesh, they could expect much larger learning gains. Foundational literacy would double in Ghana, quintuple in the DRC, and would on average close nearly 40 percent of the gap to SDG 4.1.1 across all 18 countries. In the average country, a learning agenda yields 4 times the gains of an access agenda.
While this analysis has focused on literacy, the same conclusions also hold qualitatively for numeracy, although the magnitudes are smaller. In summary, while some countries would benefit more than others from expanding access—and there is a real need for country-specific analysis—following the ‘business as usual’ approach to reform by expanding access to schooling will usually not be sufficient to close the yawning gap between current learning levels and the SDGs.
Learning profiles are also a useful tool to simulate the consequences of another common education reform agenda: equity and inclusion. The equity and inclusion agenda is often focused on closing in-country gaps between groups, especially those associated with gender, wealth, and urban versus rural geography.
Let’s start with gender. Figure 8 disaggregates learning profiles by gender.
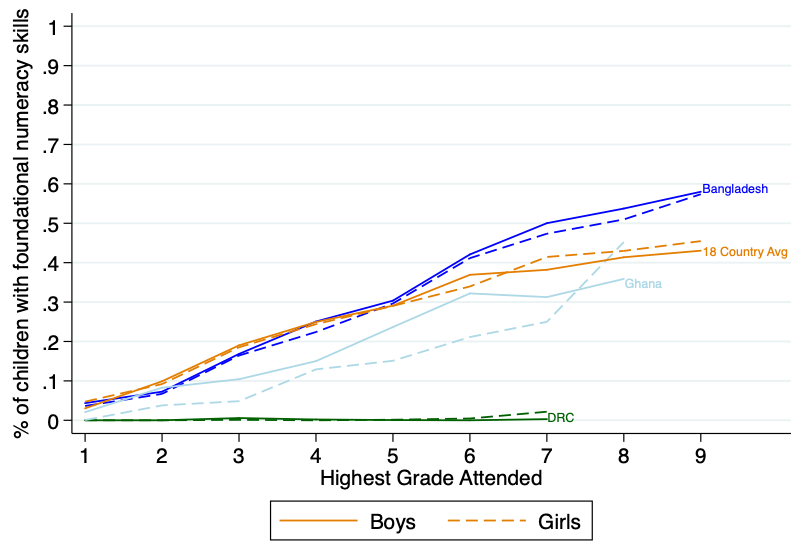
Source: Author’s calculations using UNICEF MICS6 data
On average, boys (solid lines) and girls (dotted lines) are learning the same amount as they move through school (and girls actually perform slightly higher by Grades 7-9). However, there are specific countries, such as Ghana, where this is not true and gender is more of a dividing line for who is learning.
Figure 9 zooms in on the learning differences between boys and girls. Each line represents a different country from the dataset.
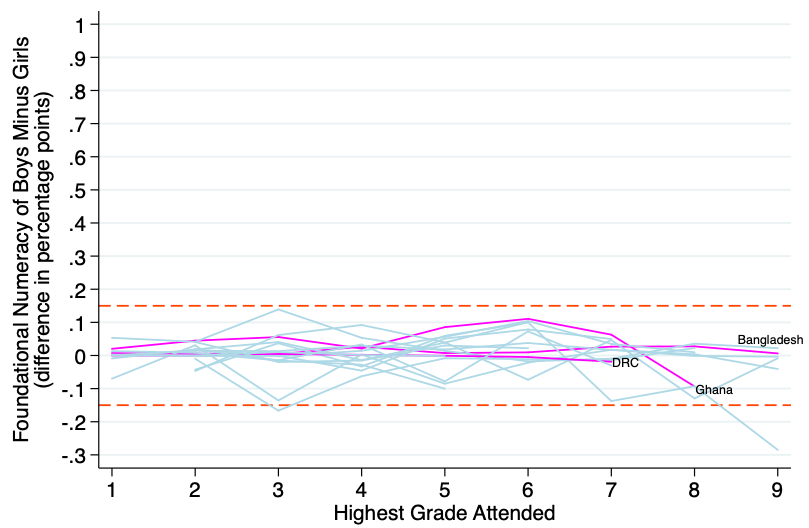
Source: Author’s calculations using UNICEF MICS6 data (Note: Sample limited to grades with >100 unweighted observations per gender)
As is clear, the difference between boys and girls is relatively small in almost every country and grade. It is almost always less than .15 percentage points, and more often than not it is girls who are learning more than boys (across all countries and grades, girls have 1 percentage point higher numeracy than boys, and 3 percentage points higher literacy). There’s a learning crisis for boys and girls in nearly equal measure.
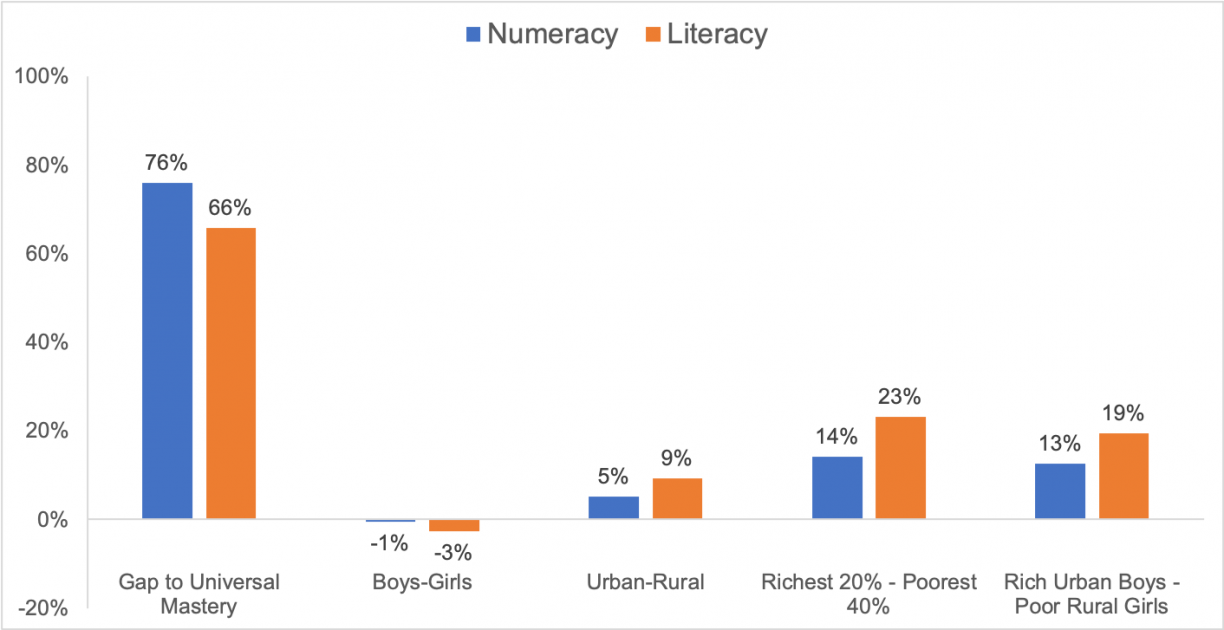
Figure 10 extends the analysis to other “sources” of inequity and inclusion (Crouch, Rolleston, and Gustafsson, 2021), and benchmarks them against the large absolute gap to universal mastery (the leftmost bars). Each bar averages across the 18 countries in the dataset.
Source: Author’s calculations using UNICEF MICS6 data
Gender differences are, on average, the least significant dimension of inequity. Other dimensions of inequity, especially wealth, are more significant, but still small relative to the absolute gap to universal mastery of foundational skills. This observation also holds for overlapping or multidimensional inequity: rich, urban boys learn more than poor, rural girls, but even the triply advantaged are far away, in absolute terms, from basic literacy and numeracy.
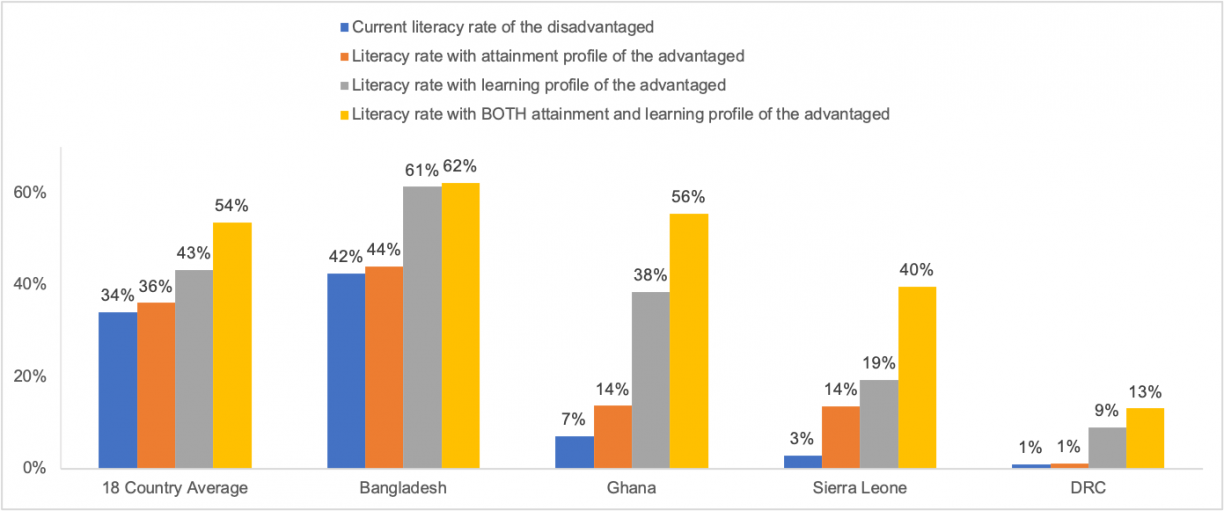
As in Part 3 above, we can again use learning profiles to simulate the gains to learning from pursuing a particular reform agenda, in this case an equity agenda. Following the methodology from previous RISE work that ran similar simulations using data from citizen-led assessments (Akmal and Pritchett, 2021), Figure 11 shows the expected impact of three different equity agendas: ensuring the disadvantaged and advantaged stay in school for the same number of years (orange bar); ensuring the disadvantaged learn as much as the advantaged each year they spend in school (grey); and equalising both the years in school and the amount learned per year between both groups (yellow).
Source: Author’s calculations using UNICEF MICS6 data
Equalising access to schooling between the advantaged and disadvantaged would do little for literacy in the average country (2 percentage points difference). Equalising the learning profile would do more, particularly in countries where there is greater inequality (i.e., Ghana). However, even achieving full parity between rich, urban boys and poor, rural girls would close only 30 percent of the gap to universal literacy in the average country, leaving more than 45 percent of kids still unable to read a basic story and understand it. If countries eliminated the overlapping inequalities in learning associated with gender, wealth, and geography, far too many children would still not reach the low-bar SDG targets for foundational skills.
Achieving in-country equality doesn’t help that much because even the advantaged are not doing that well (Pritchett and Viarengo, 2021). Learning is low across entire education systems. This points to the need to focus on absolute rather than relative outcomes (Newman, 2021) and prioritise changes that shift the entire education system toward producing more learning (Spivack, 2020) for the advantaged and disadvantaged alike.
As RISE enters its final years, parts of our network have begun working with external partners to institutionalise the use of learning profiles and related tools (Kaffenberger and Pritchett, 2021). These partnerships are developing tools and trainings to enable practitioners and policymakers to understand learning profiles, explore related RISE messages, and apply them to their own contexts. If they are widely adopted, learning profiles can be a powerful catalyst to shift the conventional wisdom around global education reform and move toward a new set of principles for tackling the learning crisis.
Akmal, M., and Pritchett, L. 2021. “Learning Equity Requires More than Equality: Learning Goals and Achievement Gaps between the Rich and the Poor in Five Developing Countries.” International Journal of Educational Development 82 (April): 102350. https://doi.org/10.1016/j.ijedudev.2021.102350
Belafi, C., Hwa, Y. and Kaffenberger, M. 2020. Building on Solid Foundations: Prioritising Universal, Early, Conceptual and Procedural Mastery of Foundational Skills. RISE Programme, RISE Insight Series. 2020/021. https://doi.org/10.35489/BSG-RISE-RI_2020/021
Chiplunkar, G., Dhar, D. and Nagesh, R. 2020. “Too Little, Too Late: Improving Post-Primary Learning Outcomes in India.” Unpublished, 29.
Crouch, L., Rolleston, C. and Gustafsson, M. 2021. “Eliminating Global Learning Poverty: The Importance of Equalities and Equity.” International Journal of Educational Development 82 (April): 102250. https://doi.org/10.1016/j.ijedudev.2020.102250
Das, J., Daniels, B. and Andrabi, T. 2020. Human Capital Accumulation and Disasters: Evidence from the Pakistan Earthquake of 2005. RISE Programme, RISE Working Paper Series, 20/039. https://doi.org/10.35489/BSG-RISE-WP_2020/039
Hwa, Yue-Yi, Michelle Kaffenberger, and Jason Silberstein. 2020. Aligning Levels of Instruction with Goals and the Needs of Students (ALIGNS): Varied Approaches, Common Principles. RISE Programme, RISE Insight Series, 2020/022. https://doi.org/10.35489/BSG-RISE-RI_2020/022
Kaffenberger, M. 2019. A Typology of Learning Profiles: Tools for Analysing the Dynamics of Learning. RISE Programme. RISE Insight Series. 2019/015. https://doi.org/10.35489/BSG-RISE-RI_2019/013
———. 2020. Modeling the Long-Run Learning Impact of the COVID-19 Learning Shock: Actions to (More Than) Mitigate Loss. RISE Programme. RISE Insight Series. 2020/017. https://doi.org/10.35489/BSG-RISE-RI_2020/017
Kaffenberger, M. and Pritchett, L. 2020. “Aiming Higher: Learning Profiles and Gender Equality in 10 Low- and Middle-Income Countries.” International Journal of Educational Development 79 (November): 102272. https://doi.org/10.1016/j.ijedudev.2020.102272
———. 2021. “A Structured Model of the Dynamics of Student Learning in Developing Countries, with Applications to Policy.” International Journal of Educational Development 82 (April): 102371. https://doi.org/10.1016/j.ijedudev.2021.102371
Kaffenberger, M., Sobol, D. and Spindelman, D. 2021. The Role of Low Learning in Driving Dropout: A Longitudinal Mixed Methods Study in Four Countries. RISE Programme. RISE Working Paper Series. 21/070. https://doi.org/10.35489/BSG-RISE-WP_2021/070
Muralidharan, K., Singh, A. and Ganimian, A. 2019. “Disrupting Education? Experimental Evidence on Technology-Aided Instruction in India.” American Economic Review 109 (4): 1426–60. https://doi.org/10.1257/aer.20171112
Newman, K. 2021. Yes to Girls’ Education—But Let’s Focus on Absolute Not Relative Outcomes. RISE Programme (blog). 2021. https://riseprogramme.org/blog/girls-education-absolute-not-relative-outcomes
Pritchett, L. and Sandefur, J. 2020. “Girls’ Schooling and Women’s Literacy: Schooling Targets Alone Won’t Reach Learning Goals.” International Journal of Educational Development 78 (October): 102242. https://doi.org/10.1016/j.ijedudev.2020.102242
Pritchett, L. and Viarengo, M. 2021. Learning Outcomes in Developing Countries: Four Hard Lessons from PISA-D. RISE Programme. RISE Working Paper Series. 21/069. https://doi.org/10.35489/BSG-RISE-WP_2021/069
Spivack, M. 2020. Quality Education for Every Girl for 12 Years: Insights from RISE Programme Research. RISE Programme. RISE Insight Series. 2020/015. https://doi.org/10.35489/BSG-RISE-RI_2020/015
UNICEF. 2020. Toward Achieving Inclusive and Equitable Quality Education for All: A Manual for Statistical Data Analysis Using Multiple Indicator Cluster Surveys (MICS6). https://data.unicef.org/resources/mics-education-analysis-for-global-learning-and-equity/
This essay owes much to Michelle Kaffenberger, who inspired the idea, gave thoughtful comments, and authored much of the scholarship it follows from. I am also grateful for input and support from other researchers at the RISE Directorate, in particular Carmen Belafi, Yue-Yi Hwa, Lant Pritchett, and Marla Spivack.
Silberstein, J. 2021. Measuring, Visualising, and Simulating Solutions to the Learning Crisis: New Evidence from Learning Profiles in 18 Countries. 2021/029. https://doi.org/10.35489/BSG-RISE-RI_2021/029