Abhijeet Singh
Stockholm School of Economics
Blog
How can early childhood education be improved and equalised in Tamil Nadu? Part of the answer could be increasing opening hours and time spent on academic activities in anganwadi centres.


While early childhood education is often considered key to children’s education development (see, for example, Heckman (2006) and Kline & Walters (2016)), it is often underemphasised in public policy. In 2019, the RISE India Research team collected data from every child between 2 and 5 years old in 197 villages in four districts of Tamil Nadu (see Figure 1 for a map of Tamil Nadu’s location in India, and for the location of the four districts within Tamil Nadu). This census of pre-school-aged children, together with a census of early childhood education facilities, allows us to provide a comprehensive picture of the early childhood education landscape. In total, we interviewed 19,752 households, conducted learning assessments with 22,525 children, and visited 2,209 preschool facilities. In addition, we conducted classroom observations and in-depth surveys in an anganwadi centre (public daycare centre) in each village to understand the current state of public early childhood education provision.
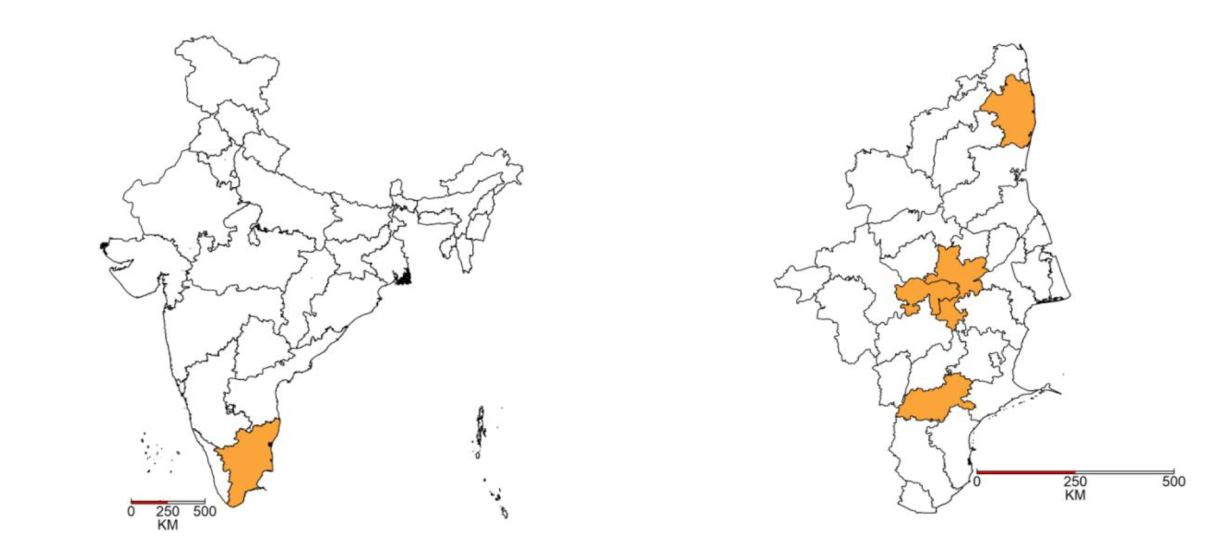
Notes: Left panel shows Tamil Nadu (shaded) in India. The right panel shows the four districts (shaded) in which we collected data within Tamil Nadu.
The public school system in Tamil Nadu currently starts at Grade 1. At the preschool level, anganwadis are the primary implementation centres for the Integrated Child Development Services (ICDS), which is meant to provide six services: supplementary nutrition, non-formal preschool education, immunisation, health check-up, referral services, and nutrition and health education. However, there is severe under-staffing of anganwadi centres where a single anganwadi worker is often supposed to deliver all ICDS mandate aspects.
The average community in our sample has about 85 children in the 2-5-year-old age group. Ten preschools cater to these children: four are public, and six are private. Older children are more like to enrol in private preschools (see Figure 2). Among 2-year-olds, most (59 percent) are enrolled in anganwadi centres, many (38 percent) are not enrolled in any type of preschool facility, and a few (3 percent) are enrolled in a private facility. A couple of years later, right before beginning primary school, private preschools have a much larger enrolment share (42 percent are enrolled in private schools vs. 47 percent in anganwadi centres).
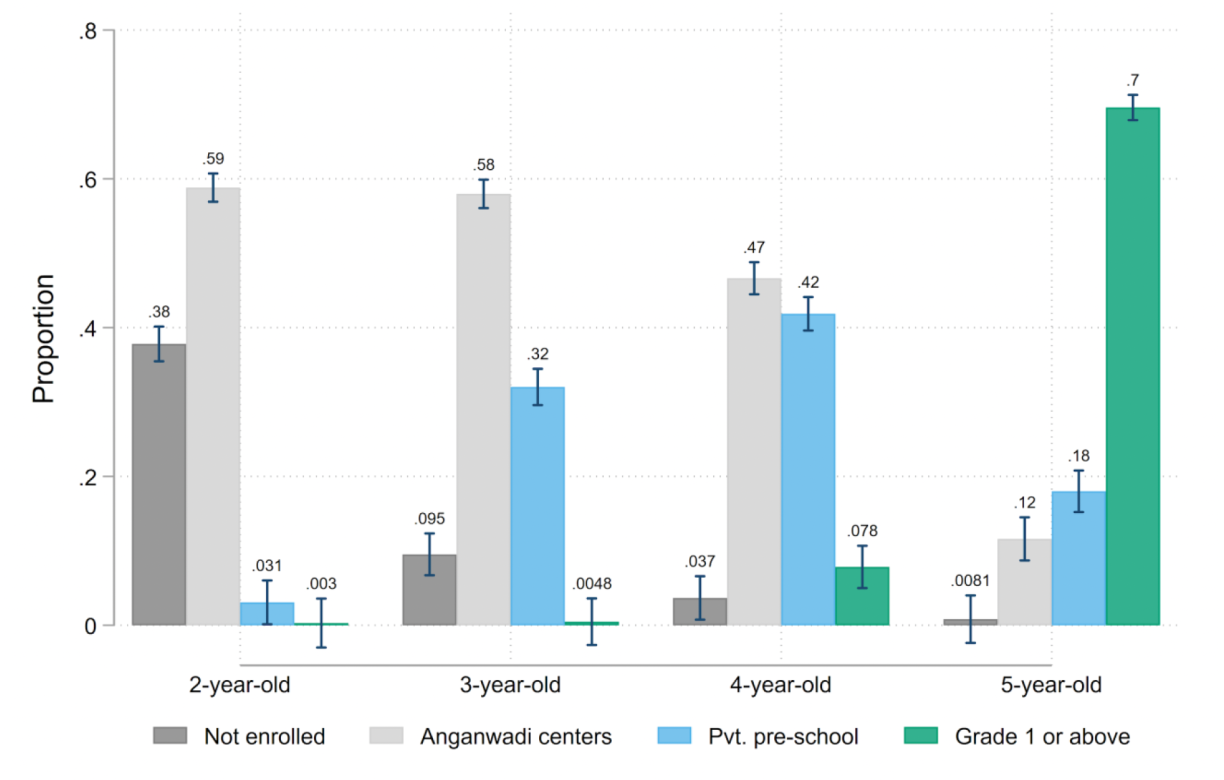
Note: This figure shows the proportion of children in each age group enrolled in different facilities (or whether they are not enrolled at all).
Private preschools charge on average 12,000 INR (~160 USD) per year for lower kindergarten and 12,200 INR (~163 USD) per year for upper kindergarten. To put these numbers in context, the mean annual household income in urban Tamil Nadu was 218,599 (~2,915 USD) INR in 2019.
We assess the learning levels in Tamil (the language of instruction) and maths of every child between 2-5 years old. As expected, children perform better as they age. However, when we look at the differences in performance across the type of school children attend, it is clear that children in private preschools perform better than their peers in anganwadi centres (see Figure 3). This difference could be driven by differences in who enrols in each school type (e.g., wealthier families are more likely to enrol their children in private preschools). Still, differences in the quality of instruction could also explain the differences in student performance.
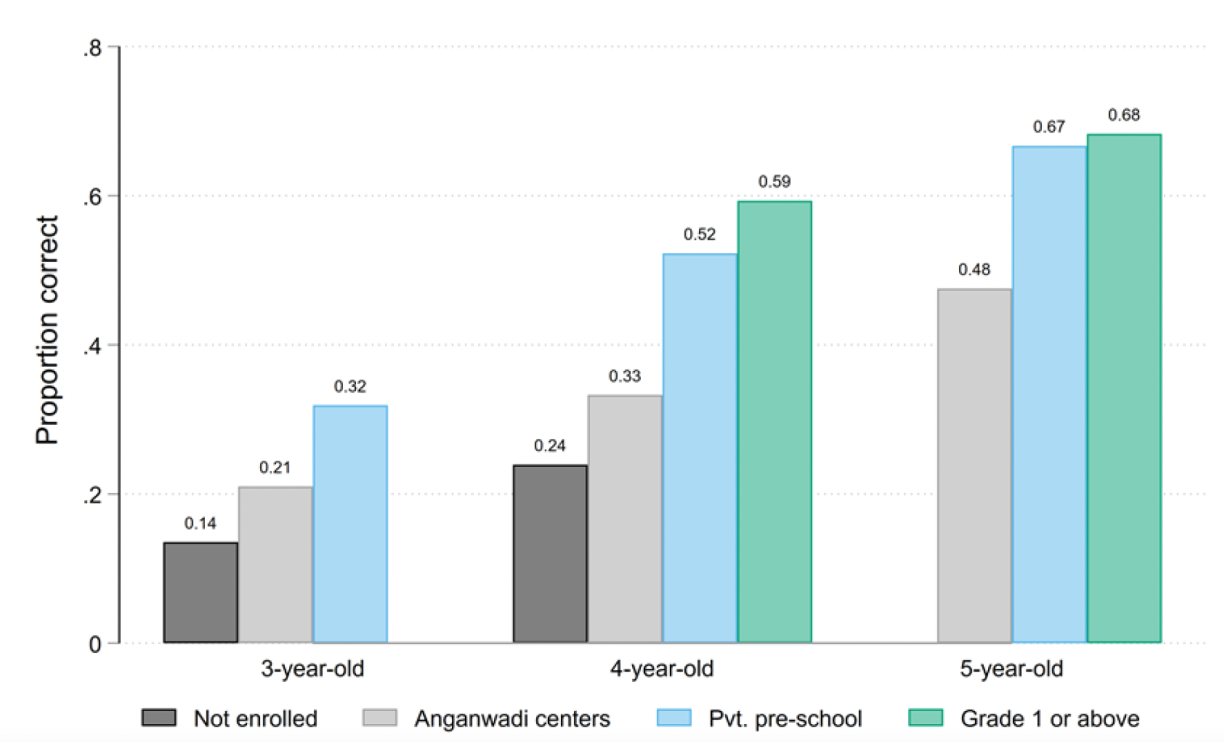
Note: This figure shows the proportion of answers children answer correctly by age group and by type of facility in which they are enrolled.
We conducted surprise visits to understand what happens on a typical day in anganwadi centres. On a typical day, 39 percent of anganwadi workers are not in the anganwadi centre.
Children are often not engaged in any type of academic activities, spending 16 minutes per day on average in these types of activities (see Figure 5). This suggests anganwadi centres provide little more than daycare and do not adequately prepare children for elementary school.
We have been engaged in an experimental evaluation of a large-scale program to improve foundational skills and school readiness by introducing lower- and upper-kindergarten classes in anganwadi centres co-located with middle schools. Teachers from the school would conduct these classes. This policy aims to provide high-quality early childhood education to children and attract parents who would otherwise send their children to private lower- and upper-kindergarten classes, saving them the financial burden of paying for private schooling. This policy capitalises on the fact that Tamil Nadu has spare teacher capacity, unlike many other states, which can improve the school readiness for incoming cohorts into Grade 1. Focusing on anganwadi centres located within middle schools’ premises allows for sharing manpower between the school and the anganwadi centre. This optimisation is typically challenging because the two facilities are overseen and administered by different departments. If successful, this pilot may serve as a template for a much broader system-level integration of services across the ICDS and the school system.
After a few months of implementation, by Feb 2020, we already had evidence suggesting the quality of early childhood education did improve as a result of the policy in treatment anganwadi centres (which now offer lower- and upper-kindergarten). Specifically, these centres were open for longer, and children spent more time on academic-related activities (see Figures 4 and 5).
In addition, while anganwadi centres are supposed to open for 8 hours (from 9:00 AM to 5:00 PM), we find that they are open on average 5-6 hours.
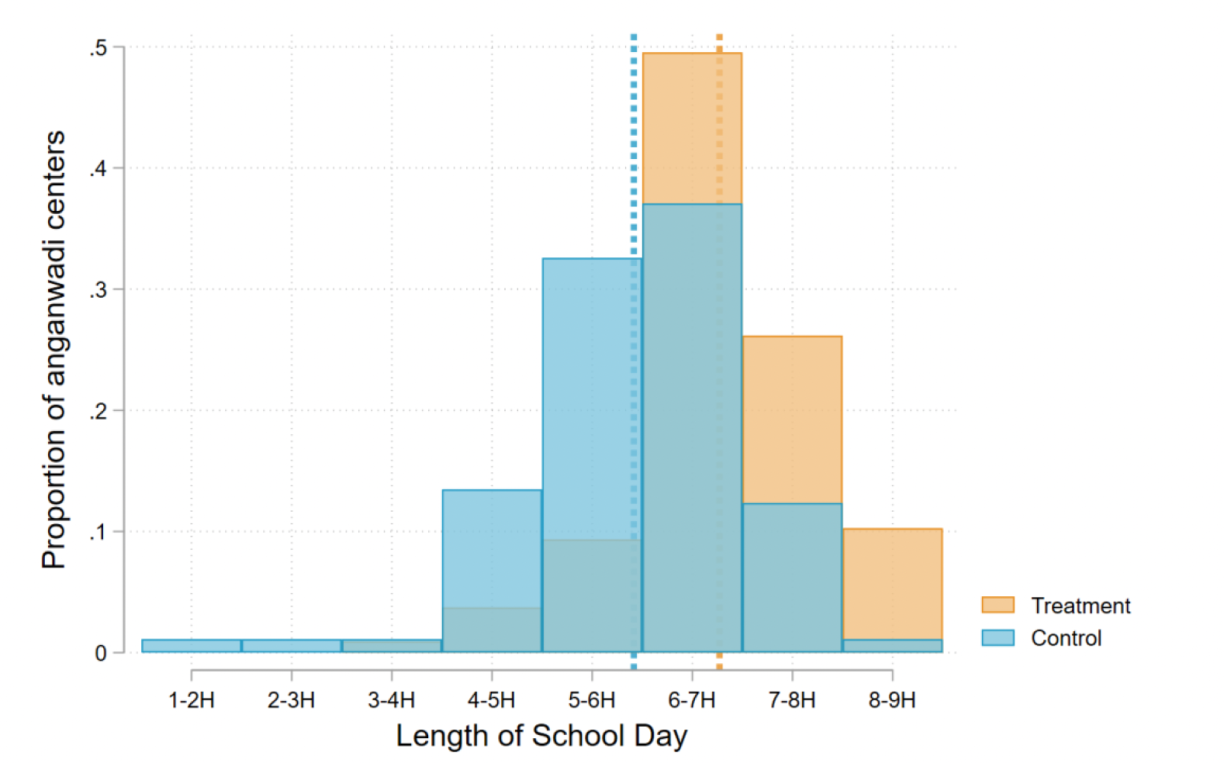
Note: This figure shows the distribution of hours anganwadi centres are open across treatment and control. Vertical lines represent the treatment and control means.
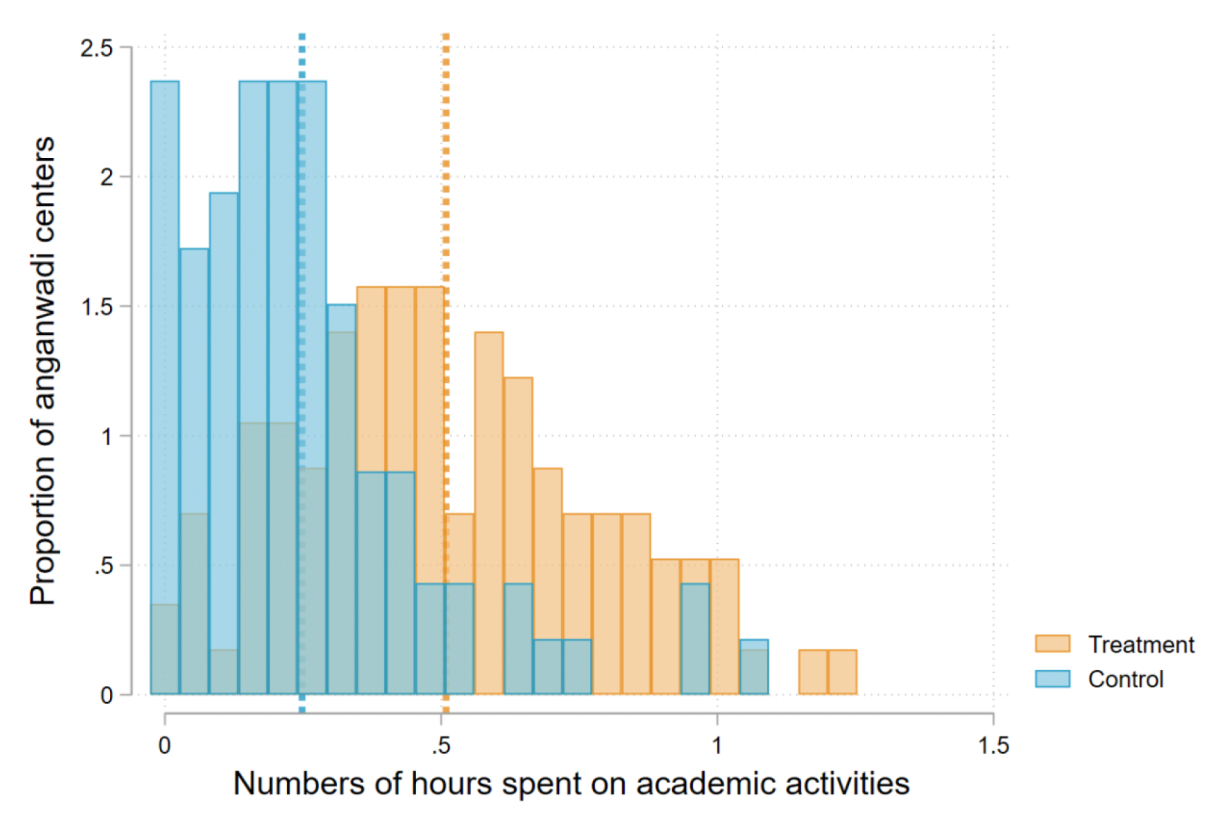
Note: This figure shows the distribution (in hours) of the time spent on-task in treatment and control at anganwadi centres. The vertical lines represent the treatment and control means.
The onset of the COVID-19 pandemic derailed the initial experiment. But it has provided us the perfect base for studying the effects of the pandemic on the landscape of preschool education, on child development, and for us to set up further work on understanding educational markets and parental choices around enrolment at school entry age. This agenda, with a special focus on socioeconomic inequalities and village-level impacts across the private and government sectors, will be a core priority for us in 2021 and 2022.
Author acknowledgements: Ramamurthy Sripada, Sharnic Djaker, Shruti Agarwal, and Malavika Divakaran provided excellent field management and research assistance.
RISE blog posts and podcasts reflect the views of the authors and do not necessarily represent the views of the organisation or our funders.