Carmen Belafi
Blavatnik School of Government, University of Oxford
Blog

Blavatnik School of Government, University of Oxford
In German, we have a saying: ‘Der Weg ist das Ziel’. It translates roughly to ‘the journey is the goal’ and is commonly uttered to those who are too quick to have their eye on the end result rather than the process of getting there.
Education, too, is sometimes guilty of favouring outcome over process. With much focus on measuring learning outcomes, often late in the schooling cycle, less attention has been given to the process that leads to observed learning outcomes. Many factors need to come together to produce the outcome of learning over time, creating a child’s overall learning experience.
To better capture these parameters that produce learning, Michelle Kaffenberger and Lant Pritchett in a recent working paper introduce a model to simulate cohort learning. This tool has a technical name—Pedagogical Production Function—but it has real-world applications for policymakers who want to understand the learning trajectories of children and how different reforms will improve learning in their education system.
In this three-part blog series, I will first explain and showcase what a pedagogical production function is and how it can be built to replicate the learning process of specific contexts. A second blog will apply the PPF to the real-life example of COVID-19 related school closures to simulate consequential learning losses and potential responses. Finally, a third blog will map out how the PPF as a conceptual tool may offer helpful guidance to policymakers.
But first things first.
The pedagogical production function, or PPF, is a model that simulates how much, on average, a child at a certain skill level learns over a certain period of time (usually one year) in a certain grade. Against this backdrop, learning is the process of increasing children’s skills/competencies/capabilities over time. The PPF is a dynamic simulation of learning profiles, as learning profiles depict how much children learn over time.
The PPF model incorporates findings about learning from the burgeoning literature on learning profiles:
First, the learning experience in any classroom is not the same for children at different skill levels. Classrooms are naturally diverse – all classrooms at any grade around the world have students at different skill levels, albeit to varying degrees. Especially in developing countries, this heterogeneity can make effective classroom instruction difficult. A recent study in Delhi, India found that students enrolled in the same grade typically span five to six grade levels in skills, with most students below the grade-level standard. By grade 8, there was a substantial skill variation in a single classroom, as skill levels ranged from grade 2 to grade 8, and children were on average four years behind the curriculum.
The PPF starts from this initial skill distribution of students, and recognises that students will benefit more or less from the same classroom instruction depending on their skill level. This means that students on different points in the skill distribution will have different gains in learning over time. Some children may not learn anything at all, either because instruction is too simple, or (the much more likely scenario) because they have fallen too far behind to benefit from classroom instruction, preventing them from increasing their skill level altogether. When this happens, the learning produced by the PPF for these children will be zero going forward.
But even the children that do learn don’t necessarily do so in a uniform way. The PFP allows learning to differ across the student distribution. Based on the learning profiles literature, the authors assume that students at higher initial skill levels will be able to learn more every year than those at lower skill levels. However, the PPF could easily be adapted to different scenarios where all children learn the same amount in a classroom (although this is never the case in empirically observed cases), or where instruction has a strong equity focus to boost the learning process of initially weaker students, or could assume that students at the center of the skill distribution learn the most, with gradual declines in learning for students at both higher and lower skill levels. This results in a variety of different shapes that the PPF can take.
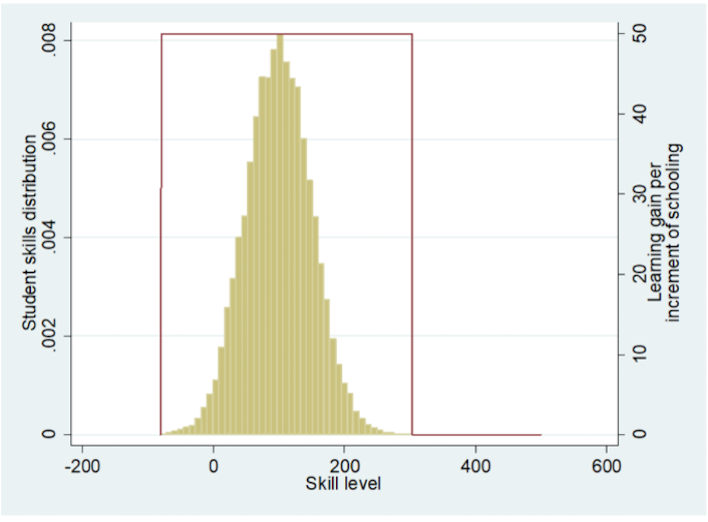
The simplest PPF where all children learn the same
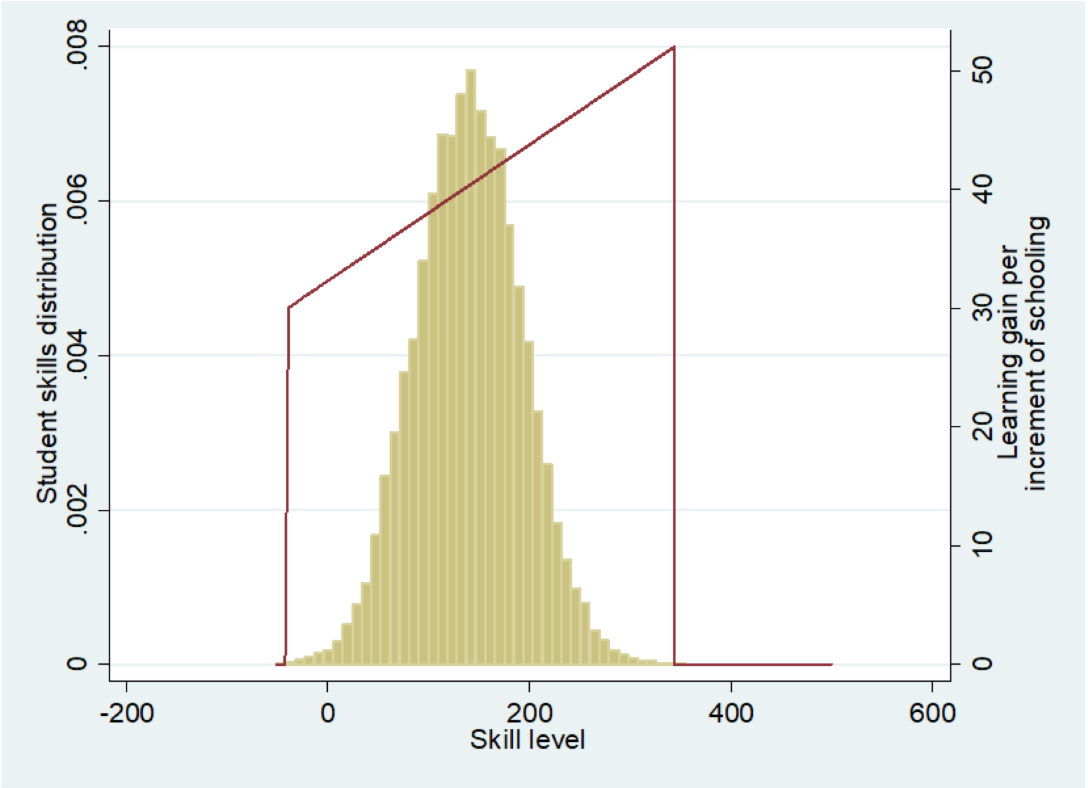
Instruction increases linearly with initial ability; trapezoidal shape
The PPF incorporates classroom instruction in its height and width.
The height of the PPF demonstrates the learning gain in a year of schooling, i.e. how much a student’s skill level increases during one year. Better trained teachers may be able to translate instruction time more effectively into more learning, without changing any other parameters of the PPF. Keep in mind that the height of the PPF does not measure how much content teachers teach, but how effectively they enable children to improve their skill level by understanding, internalising, and applying what’s being taught.
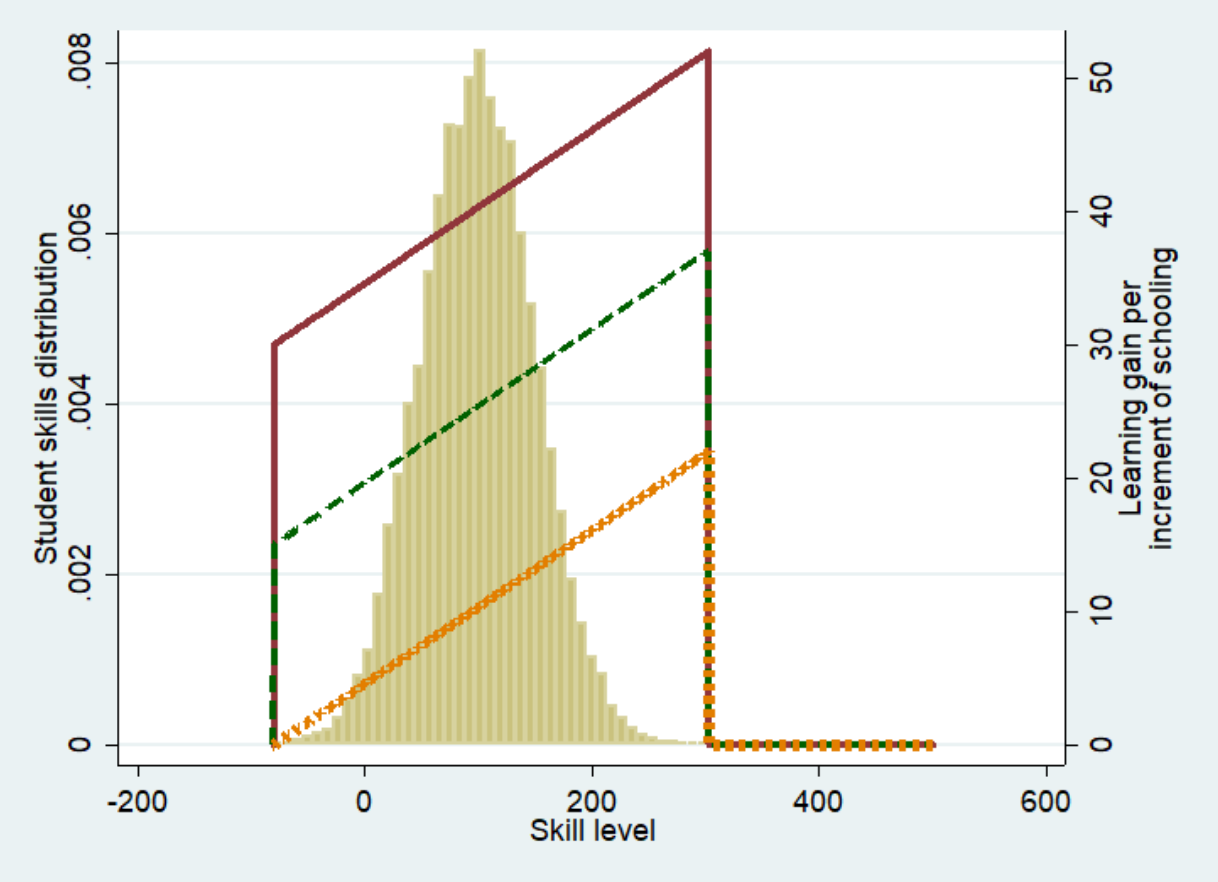
3 PPFs of varying height; other parameters constant
The width of the PPF shows the range of skill levels at which children learn something (instead of nothing). It depicts whether classroom instruction is focused on a narrow or wider range of skill levels. The more heterogeneous the skill level in a given class, and/or the narrower the focus of classroom instruction, the more children will fall outside the range of the PPF and be left behind. If teachers are able to teach to a wider variety of skill level within the class, this increases the width of the PPF and, consequently, cohort learning. But it is important to note that even the most gifted and motivated teacher will have difficulty leaving no child behind if skill levels are too varied.
Learning does not just depend on what children know or what they’re taught, but on the alignment between the two. Learning happens when initial skill level and level of instruction are compatible, when children are taught something that they possess the foundations to understand, grasp and apply, taught at a pace and level of difficulty comprehensible to them.
The PPF incorporates this by defining a centre of instruction. This is the skill level on which classroom instruction is centred. In other words: Children at which skill level are teachers targeting with their classroom instruction? What is the skill level that teachers expect of children to be able to learn something in class? The bigger the disconnect between students’ skill levels and level of instruction, the less centred teaching becomes and the less learning happens. Learning is not produced by simply teaching more in less time, but by teaching children at their level so they first gain solid foundational skills upon which they can then build higher-order skills.
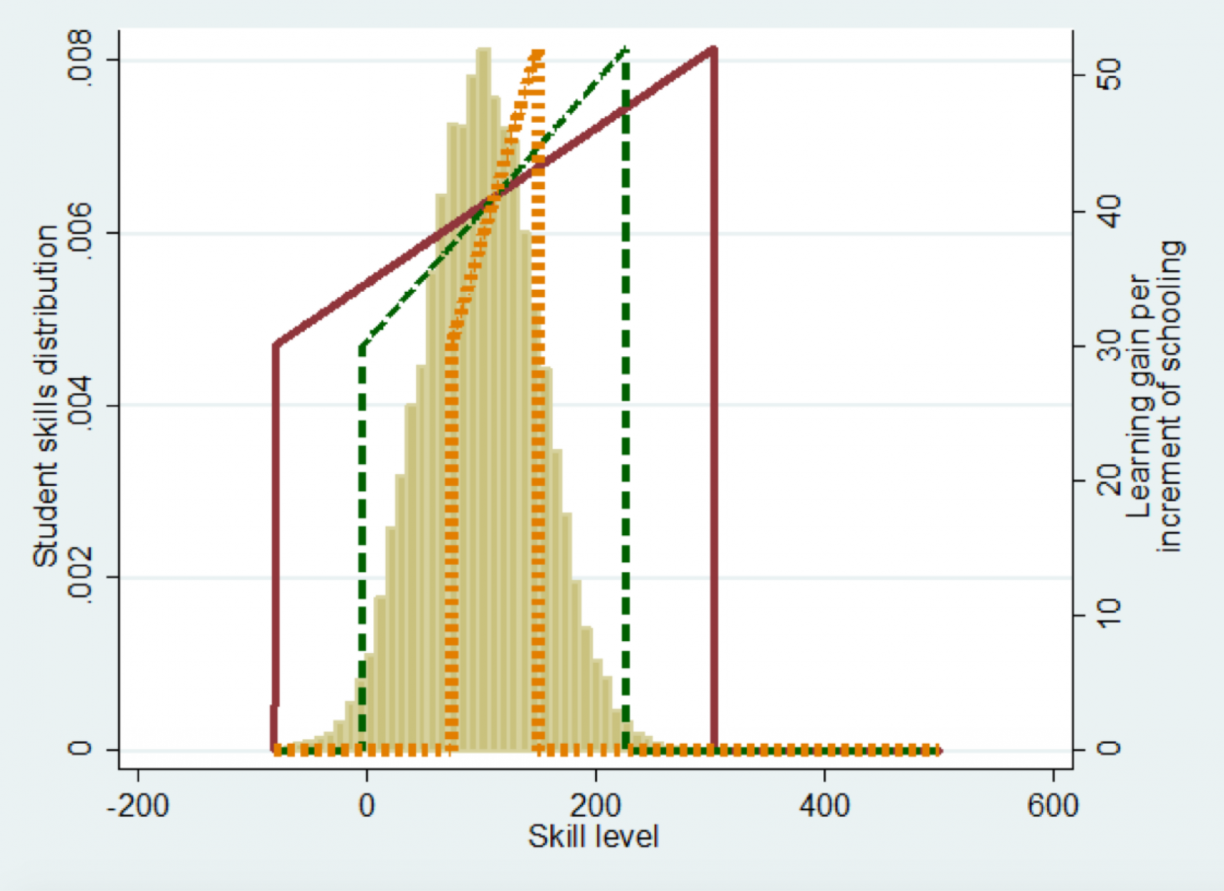
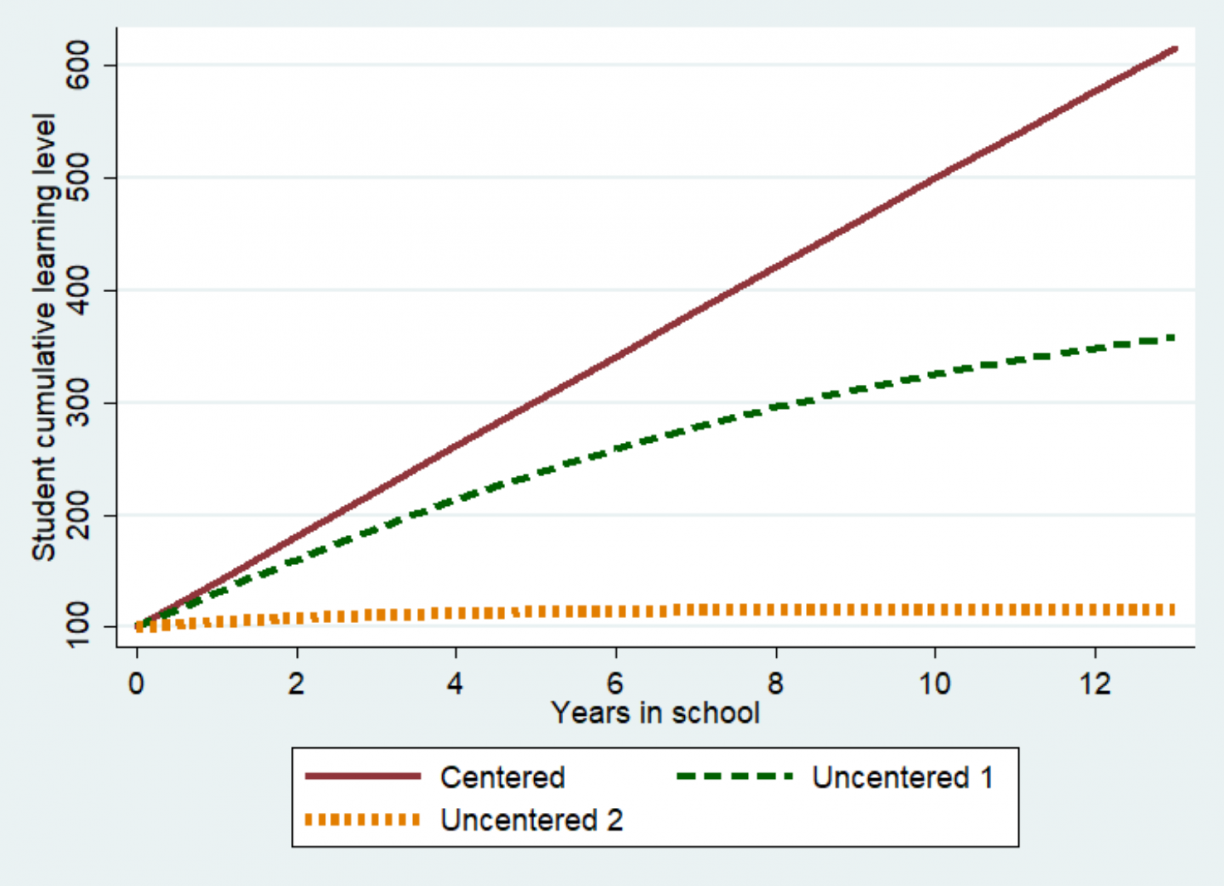
The centredness of instruction has a direct impact on learning profiles. As instruction becomes more advanced, the PPF moves to the right on the x-axis in the illustration below. Changing this single variable alone creates very different learning profiles. PPFs that are more centred on student abilities produce more learning (as reflected in the red line), whereas less centred PPFs will produce less learning (green and yellow line) as more and more children fall outside the range covered by the PPF, and do not learn.
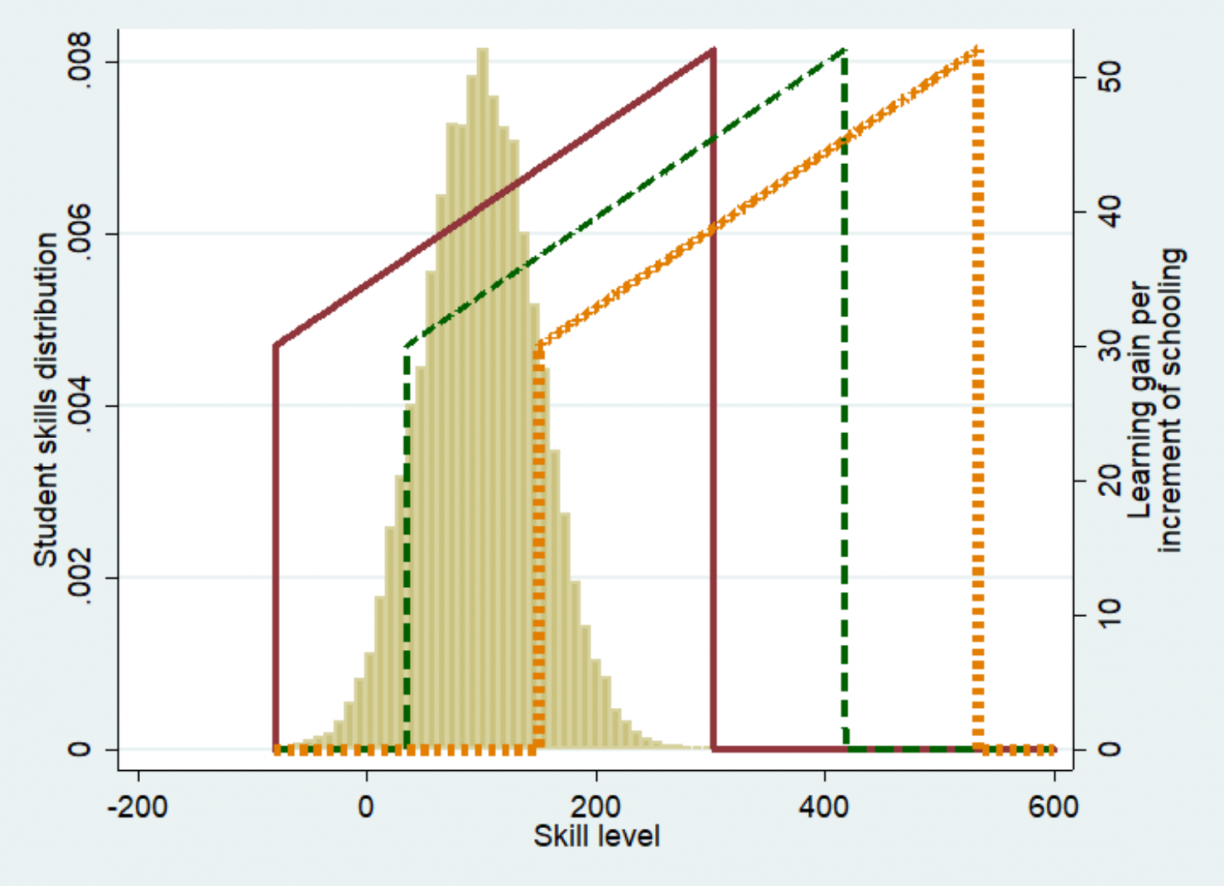
3PPFs with same area = same "ability", but with varied centredness
The centre of the PPF also depends on the pace at which the PPF advances from the previous year. As children move to a new grade, they are assumed to have higher skill levels, and therefore teaching will move to more complex topics, shifting the centre of the PPF upward each year with grade progression. This pace can be adapted just like any other parameter of the PPF. In practice, centre and pace are mostly set by the national curriculum. Often, curricula are overambitious and require teachers to centre their instruction not on the actual distribution of student skills, but on the top performers. When this happens, low performers cannot match the pace of curriculum and start falling behind, eventually falling outside the range of the PPF and learning nothing, even if they remain in school.
As a result, the PPF can model not just children’s skill levels and the quality of classroom instruction, but whether there is alignment between children’s skill levels and instruction level and pace. It can model whether children are able to follow and how many fall outside the ‘teachable’ range of skill levels under different scenarios.
Research is still in the early stages of applying the PPF to different data sets and empirical examples. For instance, Michelle Kaffenberger uses the PPF to simulate learning losses due to Covid-19 and to demonstrate the potential effectiveness of different remedial strategies once schools reopen. To learn more about the application of the PPF to the Covid-19 shock, read the next blog of this series for a more in-depth description.
*All illustrations in this blog are taken from Kaffenberger 2019.
RISE blog posts and podcasts reflect the views of the authors and do not necessarily represent the views of the organisation or our funders.