
Daniel Rodriguez-Segura
University of Virginia
Blog
Educational interventions focused on improving basic skills are an effective way to broadly reduce inequality of learning outcomes, even if they do not explicitly target the most vulnerable populations.
By now, many policymakers and researchers are aware that there is a learning crisis in low- and middle-income countries (LMICs). The World Bank estimates that over half of the children in LMICs were unable to read and understand a simple text by age 10. In other words, the overall achievement level of educational attainment is low in LMICs.
Yet, the policy discussion around the distribution or inequality of learning outcomes in LMICs, particularly in foundational skills, has been more scant. We believe that along with the general level of learning, understanding better the dispersion of these outcomes, especially foundational literacy and numeracy, is highly relevant for policy and pedagogical educational planning in LMICs. As such, we advocate for the use of “learning inequality” as a complementary indicator of the state of learning in LMICs.
In a new paper—Looking beyond changes in averages in evaluating foundational learning: Some inequality measures—we apply tools from the field of economics to characterise learning inequality in several low- and lower-middle income countries. We present two key findings: first, that learning inequality is significant not only between schools, but within them; and second, if interventions focus tightly on foundational skills, they can improve not only average outcomes but also significantly reduce inequality.
Of course, we would not expect all children in a class or school to have the same achievement level, so there is some degree of “learning inequality” that we would expect to occur naturally. Yet, there are other factors that can widen this learning inequality in LMICs, making these differences in learning outcomes particularly challenging for educational planning. These other factors are the contributors to learning inequality that we want to focus our attention on, at least conceptually.
We know that the increase in school enrollment in LMICs has brought a large number of first- and second-generation students, often more disadvantaged than their peers, into educational systems around the world. The presence of these students, while clearly a positive step for education, can increase the range of learning outcomes in a class and certainly between schools. When coupled with weak incentives to target teaching at the full range of abilities in a classroom as opposed to only the top performers, limited instructional skills to do so, and very large student-to-teacher ratios, these factors can yield unhealthy levels of learning inequality which may in turn hamper student learning.
Economics has a long history of measuring concepts like income or wealth inequality, leveraging methodological tools like the Gini coefficient, or Px/Py ratios (the ratio of average income at the xth percentile of the income distribution to the average income at the yth percentile) to do so. In our paper, we explore how these metrics perform on early literacy data—in particular, whether we can calculate these scores in a way that yields novel and relevant information. Although we calculate all of these metrics, we pay special attention to the Gini coefficient, given its widespread use and ability to visualise distributional changes through the “Lorenz curves”1 .
As our main data source, we use EGRA data from six contexts—particularly the reading fluency scores measured in units of “correct words per minute”, as a measure of oral reading fluency (ORF). Reading fluency2 has the advantage of having an intuitive interpretation, and being the closest analogue in the dataset to the more colloquial meaning of “being literate”3 .
Our paper discusses three main results. First of all, most of these metrics can be calculated for reading achievement in several contexts. We find that the Gini coefficient performs particularly well (it does not lead to division by zero, and differences between Ginis quickly make sense when one thinks about them), but interestingly, these scores tend to be higher than those observed for income at a country level—meaning that at least for these samples, learning inequality is greater than more recognisable benchmarks of income inequality. We also find a very strong negative relationship between the Gini coefficient and overall achievement level4 .
Second, computing Lorenz curves, their corresponding Gini coefficient, and contrast plots, where one can show the net difference between two Lorenz curves of interest, can provide valuable insights into distributional changes across sub-groups (e.g., the treatment and control groups in an RCT) or across time (e.g., at the beginning and end of Grade 1 for the same sub-group). For instance, we show below the Lorenz curves and contrast plots for the Grade 2 treatment group of the PRIMR foundational learning improvement intervention in Kenya before and after the intervention, showing what portions of the distribution changed the most in terms of inequality.
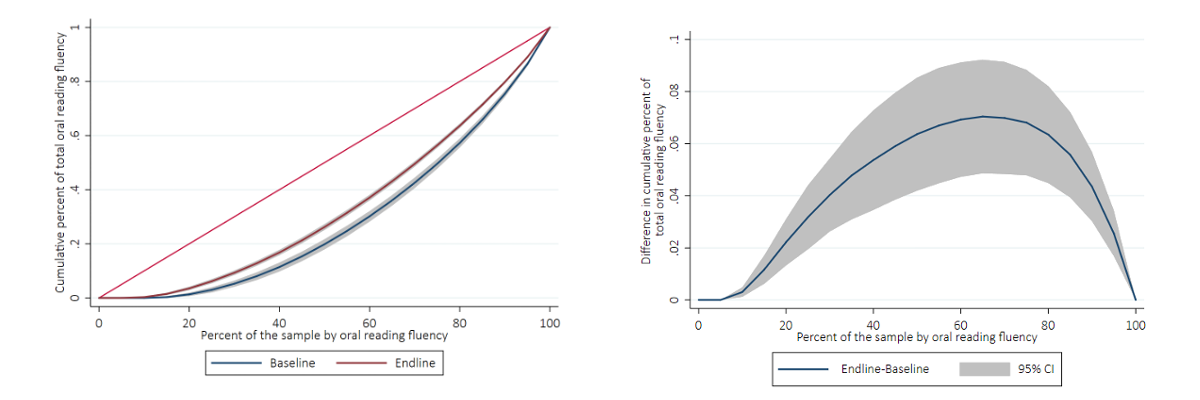
Lorenz curves on the left panel, and contrast plots on the right panel.
The short left tail of the contrast plot mimics the short left tail of the Lorenz curves, and represents approximately 1 in 10 children that could not read a single word in English even after the intervention. Examining the contrast plot, inequality decreases from baseline to endline, especially as percentiles of achievement increase, reaching its maximum around the 65th percentile (meaning that the inequality improved the most when children were at the 65th percentile of reading in the baseline), where the endline distribution becomes the most equal compared to the baseline distribution. The fact that the contrast plot is always positive, and almost always statistically significant, is not a given, and conveys information about a reduction of learning inequality for these children by benefiting a large swath of these students.
Finally, we find that inequality is concentrated unevenly across schools and socioeconomic groups. We find that, generally, learning inequality is concentrated more within schools than between schools, although the extent of this varies by context and sub-sample. When we explore inequality by socioeconomic group, we see that, as expected, median reading fluency increases with SES quartile. However, when we observe measures of inequality such as the Gini, we see that lower quartiles tend to be more unequal “within themselves” than higher quartiles. In other words, poorer children in several of our sub-samples have more variation in outcomes, or “learning inequality,” than their wealthier peers.
In contexts where most students have weak learning outcomes, targeting basic skills does not cater only to students at the bottom of the distribution. It helps children around the middle of the distribution. And if the focus is sufficiently foundational, it helps the initially lowest-performing children the most. Therefore, when targeting basic skills in contexts with low achievement levels, policymakers can simultaneously improve average learning levels and decrease learning inequality. In this sense, the lower the overall achievement level within a system, the stronger the link between targeting basic skills as a way to improve learning levels and inequality. Similarly, addressing learning inequality through foundational skills will also help students from the lowest socioeconomic groups.
Improving the average scores in a class is also likely to have positive instructional implications. In other words, holding all else equal, the higher the class mean is, the more similar the educational levels of students are (both mathematically and pedagogically). After all, at least in terms of foundational literacy, the instructional needs of a student at 0 cwpm and another at 20 cwpm are more different than those of a student at 40 cwpm and another at 60 cwpm.
While a portion of the worldwide inequality is between countries, another significant portion is still within countries. In the long term, measures to improve averages in LMICs are badly needed. The hopeful news is that much can be achieved in terms of simultaneously improving averages and increasing equality by focusing on foundational skills, which seems particularly true when the initial learning levels are very low. In a policy world where greater emphasis has been placed on customisation of instruction, focusing instruction on basic skills can be a powerful “self-targeting” way to address both gaps in learning, and to aim these interventions at those children needing foundational skills the most.
RISE blog posts and podcasts reflect the views of the authors and do not necessarily represent the views of the organisation or our funders.