Luis Crouch
RTI International (Emeritus)
Insight Note

The RISE Programme seeks to provide insights to policy-makers on how to improve systems of education in order to promote learning. This is a laudable, but a very high-level goal. As the Programme moves along, it may be worthwhile, now and then, to ask whether there are sub-system issues that policy-makers ought to be paying attention to, in that they are foundational (in a causal sense) to the rest of the system, or because they are very symptomatic of overall problems.
This note argues that in some thirty-five to forty countries that are expanding education very quickly, there are learning problems that originate in the earliest grades, showing as a massive over-enrolment during this stage. In Grade 1, it is not unheard of for ratios of enrolment to population of appropriate age to be as high as 150 percent. The countries in question are typically not upper-middle or high-income countries, where the issue has been resolved. Nor, are they the very poorest countries, which have not mobilised towards massive enrolment expansions, and so “don’t even have the problem yet.” Instead, the typical countries in this situation are countries such as Rwanda, Ethiopia, Malawi, Timor-Leste, and others that have received a great deal of funding and attention from development agencies, and have expanded enrolment quickly in the last decade or two. Out of the countries in the Global Partnership for Education,about forty percent suffer from the syndrome of issues highlighted in this note. It should be mentioned that, because of the very focus of RISE, only one out of the six RISE countries to date, suffers from this syndrome to a significant extent: Ethiopia. Therefore, the arguments in this note are for countries that have serious systems problems and will hopefully learn from the RISE experience, including the identification of which sub-systems the learning should be applied to.
The over-enrolment situation is depicted in Figure 1. On the horizontal axis are the Grade/Appropriate- Age Population combinations, and on the vertical axis are the ratios. The data are based on the mean of 2008 to 2012, the most complete 5-year period available. Averaging is used to create data points even when there are only one or two data points available, and to smoothen when there are odd ups and downs in the data. Each line passes through the ratios for the countries. The yellow line is the line through the medians of the countries’ ratios.
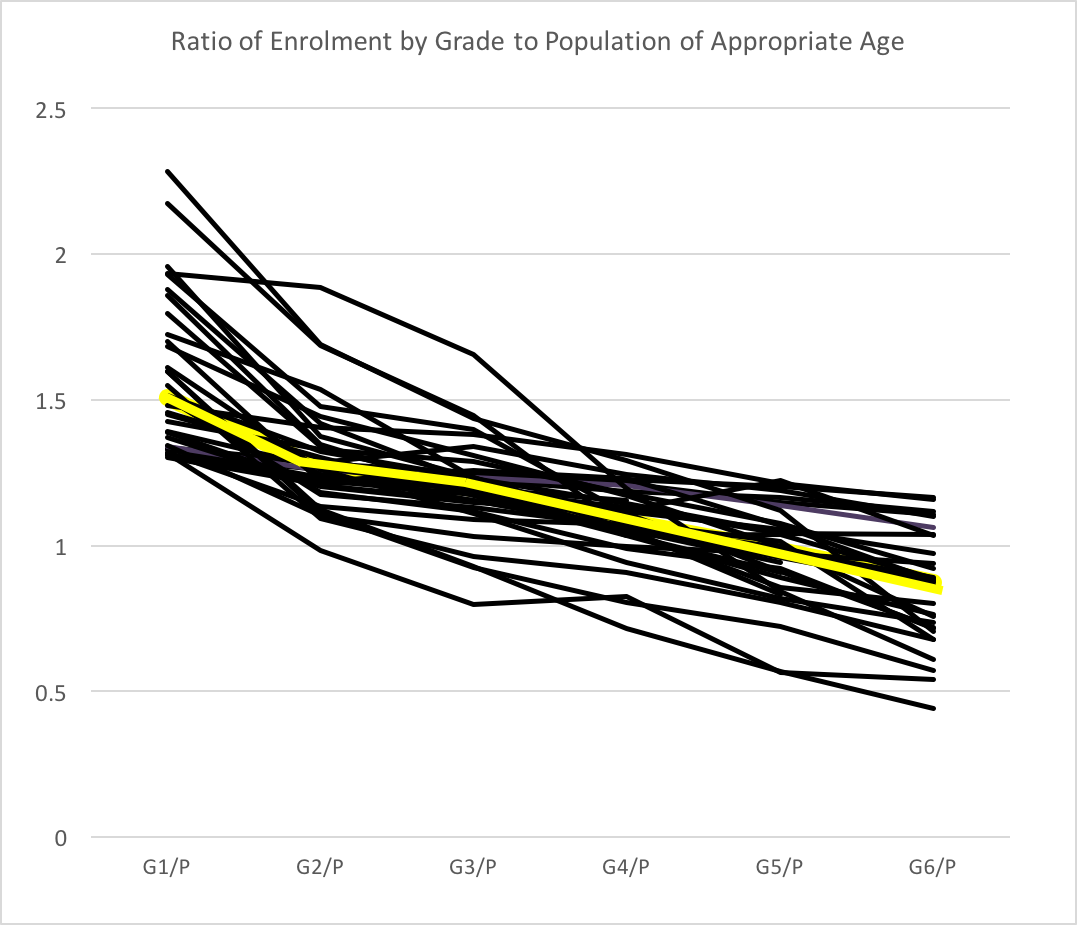
For these countries, the median ratio in Grade 1 is 1.5. This means that there are fifty percent more children enrolled than there are in the population. Furthermore, as can be noted from the median line, at least half of these countries have more enrolment than population through Grade 5, so even with drop-out, enrolment rates are above 100 percent.
This massive over-enrolment implies considerable waste. This waste shows up in several possible ways. First, in some countries the pressure of over-enrolment in the first few grades is handled via crowding in those early grades - the grades where crowding is least recommended. While most research on developing country education systems shows little advantage in reducing class sizes below a certain level, extreme overcrowding, often in classrooms where the least experienced teachers are in charge, is most likely leading to poor outcomes at the foundation of schooling systems. This probably contributes to the low levels of reading in the early grades as shown by assessments through organisations such as ASER, UWEZO, and EGRA that target these earliest grades. Second, to the extent that resources are allocated on a capitation basis, there is no relative overcrowding of the earliest grades. However, there is excessive allocation to those grades, depriving the system of the ability to focus its spending on inputs that are known to improve outcomes, but do require some spending. For example, “Teaching at the Right Level,” while increasingly proven to be an effective strategy, does require investing in tweaking curricula, making sure books are paced with the curriculum, and often requires either extra teachers or fairly intensive coaching of the teachers.
Most of the bulge is caused by repetition, and this is partly caused by extremely low levels of learning. Children repeat, formally or informally (in systems where there is automatic promotion), because parents and teachers judge that the children have not learned enough. In particular, they judge that the children have not learned the rudiments of reading
- a phenomenon confirmed by the early grades reading assessments mentioned above.
One could question the data. The data used for this analysis are based on UNESCO Institute for Statistics data which are, in turn, based on countries’ reports from their administrative systems. Perhaps data are inflated, because in some countries funding is tied to enrolment. But if that were the case, why is the over-enrolment so strongly patterned across grades (extremely high at first, then systematically declining), instead of being distributed uniformly or at random? Most likely, if there is some fraud of this nature taking place, children are not being completely invented, but are admitted into Grade 1 with the understanding that little learning will take place and therefore, children will repeat - formally or informally. Also, if these data were due only to completely fraudulent invention of children, household surveys would tend to show higher numbers, but would not typically replicate the same pattern that one observes from the administrative data reported by systems. Instead, household surveys tend to show the same pattern: gross over-enrolment in the first few grades.
Table 1 shows not just over-enrolment, but strongly patterned over-enrolment using UNICEF’s Multiple Indicator Cluster Survey (MICS) household surveys.
|
|
Grade 1 | Grade 2 | Grade 3 |
|---|---|---|---|
|
Malawi MICS 2014 |
2.6 | 2.0 | 1.8 |
|
Mozambique MICS 2008 |
1.4 | 1.4 | 1.3 |
|
Guinea-Bissau MICS 2010 |
2.6 | 2.1 | 1.6 |
|
Lao PDR MICS 2012 |
1.7 | 1.3 | 1.2 |
Source: own calculation based on MICS Surveys
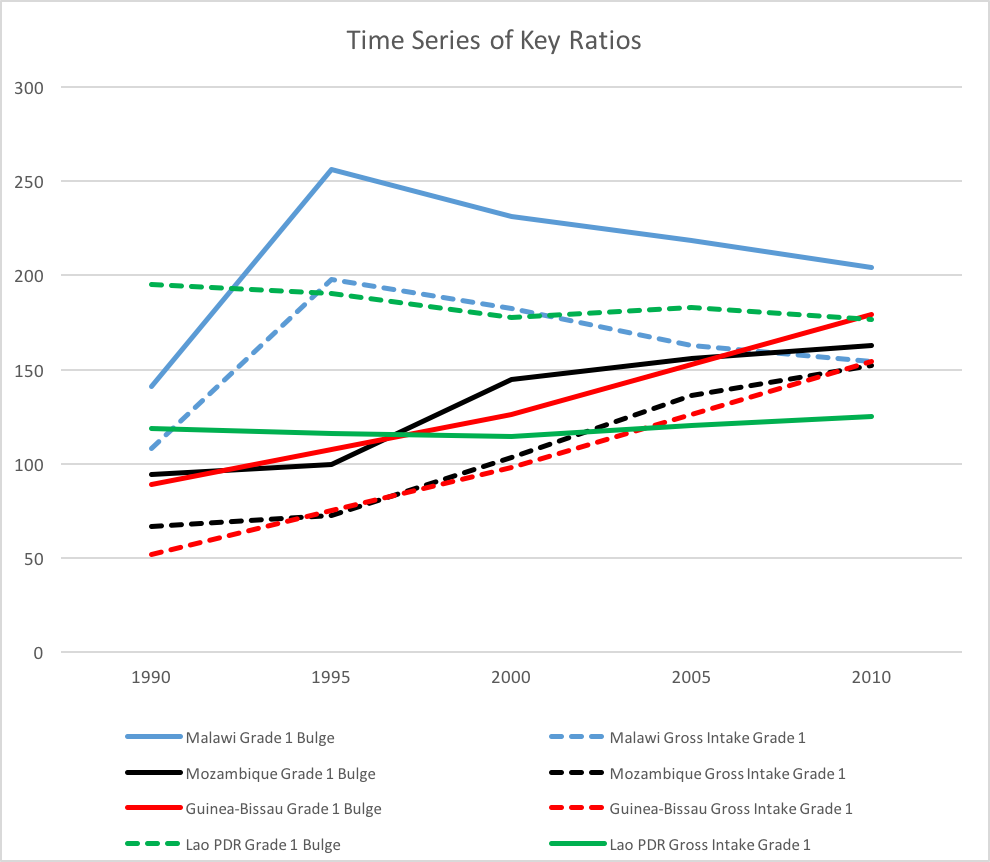
When presented with this sort of data, officials in the countries with these over-enrolment issues refer to new enrolment of over-aged children (or under-aged children). But in these systems, this is not possible, because the patterns of over- enrolment are so old. Enrolment of under-aged children cannot bulk up enrolment, unless the children are expected to repeat, and do repeat. This is because once a child has enrolled, too young or not, the child cannot appear as new again. If some children enrol too young in a given year, they will simply not be available in the pool of never-enrolled the next year, and thus cannot cause a bulking up of enrolment that year. Enrolment of new over-aged children can bulk up enrolment, but only for a few years. Recall that the over-enrolment pattern is relatively old for some countries, very old for others. Figure 2 shows the trends for two key indicators: the gross intake ratio into Grade 1, which shows the intake of putatively new (never-enrolled) children into Grade 1 over the population of appropriate age, and the ratio of enrolment in Grade 1 to the population of appropriate age. As can be seen, the intake ratio has been one or greater since at least 2000 for two of the countries, and since 1990 for two of the countries. If intake had been secularly low, perhaps 85 percent as of 1990, and if never-enrolled children would enrol as late as age fifteen, then an intake ratio of roughly 115 percent would have absorbed the never-enrolled, and would then settle down to 100 percent. But what we see in these countries is that the intake ratio keeps rising to reach levels of 150 percent by 2010 or so. The only reasonable conclusion is that this is creating an artificial bulge of enrolment in Grade 1. For these countries, the Grade 1 ratio was 177 percent - the system enrolled 77 percent more children than were of suitable age, creating a log-jam not just in Grade 1, but often in Grades 2 and 3 as well, as Figure 1 shows.
A collateral form of evidence that the bulging of enrolment in Grade 1 is mostly (undeclared) repetition, is the fact that according to calculations from the MICS surveys, children age substantially in Grade 1. For instance, according to MICS data in Mozambique, children age 1.6 years in Grade 1 and in Lao PDR, 1.4 years. In Malawi, according to the data, they age 1.7 years in Grade 1 and then1.4 years, again, in Grade 2. In Guinea-Bisssau, the figure is 2.2 years in Grade 1 and another 1.9 years of aging in Grade 2. In other words, it takes children on average 3.1 years to get through two grades in Malawi and 4.1 in Guinea-Bissau: a loss of efficiency of thirty-three percent to roughly fifty percent.
Source: Calculated from UNESCO Institute for Statistics data, via the World Bank
As noted, a factor related to the bulge is that the children are not learning much, if at all. This is attested by the many early-grade assessments that have now been conducted through the likes of ASER, UWEZO, EGRA, and others.
Though no one has researched the issue thoroughly,
there is enough evidence to at least strongly suggest that there is a set of inter-related problems going on here, all of which are pertinent to those interested in systems improvement:
Children coming to Grade 1 totally un- prepared (e.g., often hardly having seen print), and yet are expected to jump into curriculum with a strongly urban or idealistic bias (failure to “Teach at the Right Level”).
Most-crowded classrooms and least-capable teacher in Grade 1 or the early grades.
Almost no coherent support to these classrooms in “Teaching at the Right Level” (appropriately-paced curriculum, lesson plans precisely coordinated with the curricular pace, books that are also coordinated, and coaching to teachers on how to teach fundamental skills rather than the sociology of education).
Children entering with the parental and teacher expectation that they will not learn much, and that the first run- through Grade 1 will perhaps simply socialise children to school and familiarise them with print. (Though this is a very inefficient way to do this.)
The churning spills over into Grades 2 and 3, often producing a bulge there as well, as can be seen in the first graphic above.
In other research we have done, these (or similar) systems factors, taken together in one index of “foundational dysfunction,” account for about thirty-four percent of the variation in primary school completion rates. Spending per child (as a share of GDP per capita) explains only about nine percent of the variation. Not that completion of primary school is a great index of learning success, but it is an important system goal. If this relatively easy, but important system goal is pursued with such inefficiency, one can only suspect that learning goals (more difficult to achieve) are being pursued with even less systemic efficiency. But things go further than that: these problems in the foundations are probably also undermining learning levels as measured by written assessments closer to the end of the primary cycle, such as PIRLS (Progress in International Reading Literacy Study), TIMSS (Trends in International Mathematics and Science Study), SACMEQ (Southern and Eastern Africa Consortium for Monitoring Educational Quality), and others. Given the inefficiency signified by the foundation-years over-enrolment, it would not be too exaggerated to propose that “Teaching at the Right Level” could be an investment that, if tied to proper accountability measures, could essentially pay for itself, and lead to improved foundations for learning in the later grades, and (meaningful) completion of primary school. Finally, and somewhat incidentally, this problem of massive inefficiency and low quality in the early grades is why the Sustainable Development Goal on education sets an important target that all children should be reasonably proficient in reading and mathematics. It is an implicit recognition of the problems noted here, even if the international community does not realise just how serious the issue is.
Crouch, L. 2017, Weakest Part of Poorly-Performing Educational Systems: An Argument for Focus on "Teaching at the Right Level" and Improved Foundation-Year Performance. RISE Insight. https://doi.org/10.35489/BSG-RISE-RI_2017/003.