Luis Crouch
RTI International (Emeritus)
Insight Note


- The learning crisis is a crisis of learning levels, but also of learning inequity and inequality (related but separable issues); while ‘raising the floor’ where learning is concerned (by providing for acceptable learning standards among the vast majority of pupils) addresses all aspects of the crisis.
- ‘Pure inequality’ in learning outcomes, measured for example by the inter-quartile range (the difference in scores between students at the 75th and 25th percentile) is extensive in developing countries. Across data sets and countries, this measure dwarfs comparisons by gender, wealth, and location, which only partially explain low learning levels.
- Decomposing total worldwide inequality in learning outcomes, around half of the inequality is within countries, and half is between countries.
- Home life has direct and indirect effects, as students from disadvantaged backgrounds select into lower quality schools and benefit less within a school than their more advantaged peers.
- Cross-sectional data suggests that countries at the bottom of international league tables may first move up by reducing the proportion of children with very low performance, and then improve again (from a middling to high ranking) by increasing the proportion of children with high performance.
- Policies to improve learning among lower performing schools and pupils (the left-hand side of the distribution) are required to improve learning equitably and to reduce unfair inequality - a route up through the middle.
In this note, we examine the equity and inequality dimensions of the learning crisis.1We explore several questions, as follows:
Learning levels among the vast majority of children in developing countries often do not meet the expectations of national curricula, nor the much more basic levels of competence tested in citizen-led assessments (e.g., ASER, UWEZO). Moreover, the median level of achievement in many developing countries equates to approximately the 5th percentile of the distribution in OECD countries; a level at which OECD pupils may be expected to receive remedial intervention. The scale of this ‘learning crisis’ has been well documented;2 while the nature of the systemic failures that explain the prevalence of poor learning outcomes remains a key area of study, not least by RISE.3
While in many developing countries a tiny group of pupils reach learning levels comparable to OECD norms, de facto exclusion of most children from minimum acceptable learning competencies represents not only a major failure of education systems, but also an ‘equity crisis’ on a global scale. Poor learning among most children, especially where it is a result of poor quality education, is inequitable not only because it contributes to massive global (North-South) inequality, but also because the failure to develop and realise the talents of all pupils is in and of itself unjust. This latter form of inequity is not so much a distributive concern per se, but is linked to absolute notions of right or entitlement; or perhaps in Sen’s terms4, to rights to opportunities to develop valuable human ‘capabilities’ and ‘functioning’, in whose pursuit education plays a key role. It is on the development of such capabilities, rather than ‘schooling’ in a narrow sense, that the right to education enshrined in the UN Universal Declaration of Human Rights and elsewhere is founded. More recently, the Sustainable Development Goals (SDGs) represent an opportunity to focus on learning and its distribution. These goals, which replace the Millennium Development Goals (MDGs), are much more focused on learning than the MDGs were and are concerned with a minimum-proficiency approach (increasing the percentage of children reaching at least a minimum level of proficiency) and inequality, which is consistent with the empirical patterns and themes documented in this note.
Educational inequalities in developing countries are typically very high (higher than income inequalities in some cases), but average performance levels are very low (striking examples include South Africa and India).5 OECD evidence tends to suggest that educationally high performing countries on average are those with lower levels of inequality (i.e., higher average learning levels are associated with lower inequality in learning levels). But whether higher average learning levels are most readily reached specifically by reducing inequalities; or whether reduced inequalities are the likely result of more general efforts to raise learning outcomes, is an important empirical question. We consider the potential benefits of a path ‘through the middle’ whereby attention to the left hand of the learning distribution, namely the poor-performing students and schools, may serve to both improve outcomes as a whole and to reduce inequality; thereby serving two equity goals.
Raising achievement across what is, in many countries, a large bulge of poorly performing students and schools at the left of the distribution, may be an efficient strategy for raising learning outcomes as a whole. While it is an empirical question whether this is feasible, or is in fact what successful countries tend to do, it would by almost any standard be an equitable thing to do.
‘Equity’ issues are those of fairness and justice, naturally including but not being limited to, issues of inequality. While understanding inequalities in learning outcomes, such as the nature and size of ‘achievement gaps’ is largely an empirical endeavour, assessments of equity are normative and inherently require value-judgments about what constitutes ‘fairness’. Libertarians may favour more individual liberty at the expense of equality, focusing on ‘equal access to basic services’ for example; while egalitarians may favour curtailing more liberty to ensure ‘equality of outcomes’. Balancing liberty and equality, however, is a matter of justice, which, as Adler argues, is ‘sovereign’ over liberty and equality.6 While there can be ‘too much’ liberty (depriving others of their freedoms) or ‘too much equality’ (ignoring individual efforts), justice is an ‘unlimited good’ so that an ideal situation is one which provides for as much freedom and as much equality as justice allows. Perhaps the best known modern theoretical approach to such judgments is Rawls’ argument in ‘A Theory of Justice’.7
Rawls’ theory comprises two principles, requiring (i) equal basic liberties and (ii) fair equality of opportunity, the second of which requires more than ‘equal access to basic services’, but rather an ‘effective equal chance’ for individuals of similar natural endowments (equal opportunity). Rawls presents a thought experiment in which decisions concerning the organisation of society are made from an ‘original position’ behind a ‘veil of ignorance’ regarding individuals’ own starting points in terms of advantage such as creed, wealth, gender, ethnicity, and so on.8 He contends that a ‘social contract’ established from this position would embody a ‘principle of difference’ according to which inequalities are justified only to the extent that they benefit the least advantaged. That is to say, only where without such inequalities, the worst-off would be made even worse-off. In education, examples could include inequalities of access to higher education based on merit; inequalities of wages for occupations with different levels of education; or positive discrimination in higher education in favour of disadvantaged minorities. In each case, inequality may be required to create incentives or conditions which benefit society as a whole. ‘Fair inequalities’ would clearly not include inequalities of access to basic education of adequate quality linked to identity or location. ‘Fair inequalities of outcome’ are possible only to the extent that there is equality of opportunity; and as a result, society must redress inequality of opportunity or ‘level the playing field’.
The equity paradigm briefly sketched above requires that society focus on providing opportunity first for those who need it most. It is for policy-makers and social scientists to determine how to make such provision and this presents particular challenges when the target group is very large and resources are scarce. Indeed, there is probably rather more disagreement in the global education discourse concerning how to reduce inequity than on the paradigm itself. In countries where the group of pupils with very low learning outcomes amounts to a majority, policy-makers face a considerable challenge of raising learning outcomes both equitably and efficiently. For example, while it may be less costly to reach pupils in urban than in rural areas, pupils in rural areas may be expected to be more disadvantaged in socio-economic terms. However, gaps in learning outcomes need not be large across these groups in low-performing countries, especially if both groups’ ‘opportunities to learn’ (in terms of the quality of schooling) have been poor.9
Resource scarcity ensures that developing countries are constrained in terms of how much education ‘of adequate quality’ can be provided to whom; and hence, difficult decisions must be made regarding which levels of education and which pupils to focus on (for example, whether to divert higher education subsidies to basic education). Conditional on the relevant value-judgements, more equity will be always preferred to less, while the preferred distribution of opportunity must be achieved as efficiently as possible to ensure that opportunities are extended as widely as is feasible within the relevant resource constraints.
The situation with regard to inequality is less obvious in that ‘fair inequality’ may be preferable to ‘unfair equality’. For example, consider a universally poor quality education system with universally low learning outcomes. The system is considerably inequitable because it delivers unfair and unjust outcomes to all, although these outcomes and opportunities are substantially equal. The introduction of a small number of high quality schools in disadvantaged areas into such a system would arguably reduce inequity, at least in the absolute sense, by providing worthwhile and fair opportunities to develop the capabilities of at least some children. Nonetheless, it would increase both inequality of opportunity and of outcomes. Clearly a more straightforward improvement in equity would be made by providing high quality education to all, or to most pupils. Even in the latter case, however, there would still be an increase in inequality when compared to the situation of universally poor outcomes, while this may be expected to be temporary.
Access to basic education may be promoted for its intrinsic value as a ’right’, strengthening the case for ‘equal access’ as the desired (equitable) distribution. Following an instrumental logic, however, based on the benefits of education, both monetary and non-monetary, one may reach a slightly different conclusion, particularly where the distribution of higher levels of education is concerned, and where the benefits of education are substantially ‘positional’; that is dependent on scarcity and inequality in a way analogous to ‘status’. For example, where the supply of ‘decent jobs’ is fixed (at least in the short term) and educational attainment plays a role in ‘rationing’ such jobs (known as ‘screening’), increasing educational attainment may simply result in raising the ‘price’ for such jobs (‘qualifications inflation’). Where a substantial part of the private economic return to higher levels of education, in the public sector for example, is linked to ‘economic rents’ rather than productivity benefits, subsidy of higher levels of education may be argued to serve to widen inequality and worsen social justice.10 This is particularly the case if subsidies are ‘captured’ by more advantaged groups. As conceived above, equity demands that if educational access is to be ‘rationed’, this must produce only ‘fair inequality’,
which could be interpreted, for example, as inequality linked to effort or merit rather than background advantage. Without unlimited resources, educational progression must be limited, to the extent that the state meets the costs of provision; and the ways in which limits are applied, according to which education shifts from being governed by ‘right’ to being governed by ‘merit’, for example, will have important implications for equity.
Fortunately, these concerns are not serious with regard to basic education, whose benefits (particularly the social benefits), are substantially non-positional. In almost every context, more education (albeit usually measured in terms of schooling) is linked to lower fertility, lower child mortality, better adult health, better parenting, and better children’s health. Such benefits may be extended universally since they play no ‘rationing’ function (i.e., the extension of these benefits to any individual does not reduce their value to any other individual). The same may be argued in relation to further benefits including improved democratic participation, improved gender equity, and reduced crime, among many others, not least the ‘consumption’ benefits of education, namely the enjoyment of learning. On the basis of these important benefits, the notion of a right to basic education is straightforward to defend, while societies must determine what counts as ‘basic’. Nonetheless, a child whose education does not provide for adequate basic skills of literacy and numeracy, of whom there are as many as 250 million, is denied important benefits and opportunities to develop capabilities, which may be considered an absolute individual injustice, contributing to wider absolute injustice at both national and global levels.
In this section, we examine the contributions to inequality of horizontal or ‘ascriptive’ factors such as gender, location, or socioeconomic status compared to some common benchmarks and to ‘pure’ inequality without regard to ascriptive factors.
Not all international assessments present comprehensive data on the sources of inequality. However, one that does is SACMEQ II, a Grade 6 assessment in reading and mathematics applied mostly in Southern and Eastern Africa. It shows the difference that being rich or poor, being in one region or another, being a boy or a girl, being in a rural or urban area, and simply being in a top-performing group (due to whatever factors), all make. Figure 1 shows the sources of inequality, by type, for mathematics and for reading. It shows the average across all participating countries (fourteen in total).
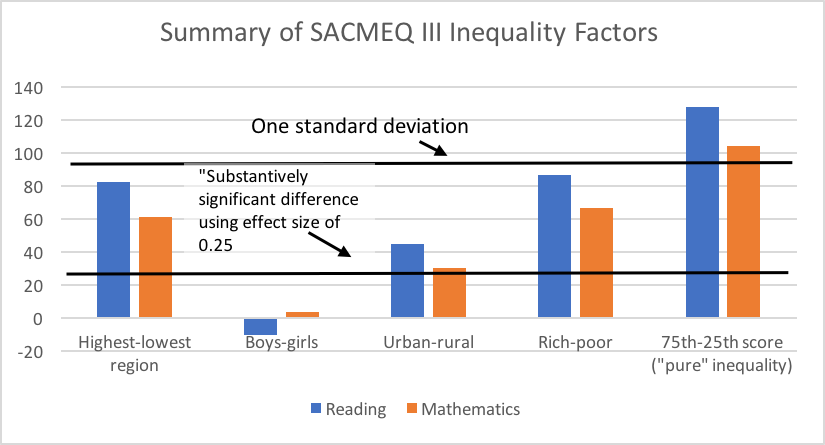
Source: SACMEQ
As can be seen, the biggest source of inequality is ‘pure’ inequality between the children scoring at the 75th percentile and those scoring at the 25th in the assessment.11 This type of ‘pure’ inequality is due to factors such as socio-economic inequality or region of residence, but, importantly, is due also to simple lack of standardisation and quality control. The difference between rich and poor (75th versus 25th percentile in a socioeconomic status index) and the differences between the highest-scoring and lowest-scoring geographical regions, are also important. The difference between rural and urban areas is right around the point of importance (effect size of 0.25). The difference between boys and girls is real but not very large at all, and in one case disfavours boys, in the other case disfavours girls.
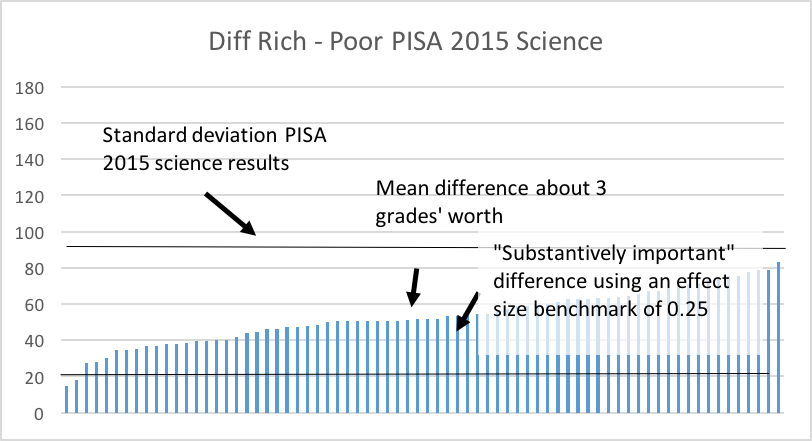
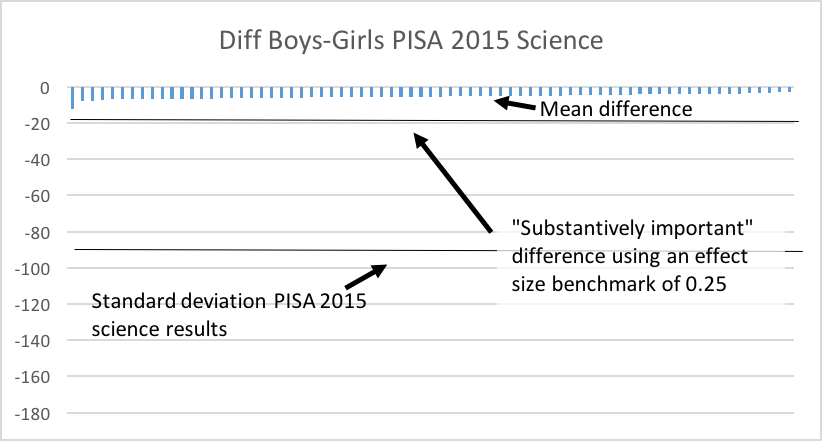
The 2015 application of PISA, an assessment that is applied mostly in OECD countries, but increasingly in developing countries, also contains the possibility of some interesting contrasts in terms of ‘pure’ inequality, gender inequality, and inequality associated with being ‘rich’ or ‘poor.’ In this case, as opposed to the SACMEQ case, we show all the countries, so that one can appreciate the variation between countries. The graphics in Figure 2 are all scaled the same, so that one can appreciate the relative size of the differences. Each graph also shows the standard deviation, and where an effect size of 0.25 would lie, again so that one can compare the differences. As with SACMEQ, by far the biggest source of variation is ‘pure’ inequality, which can be accounted for by differences between the rich and poor or between boys and girls, but importantly also reveals lack of standardisation and variation between the quality of schools. This variation is equivalent to as much as three to four grades’ worth of difference. The difference between rich and poor is significant, the difference between boys and girls, which disfavours boys, is much less significant.
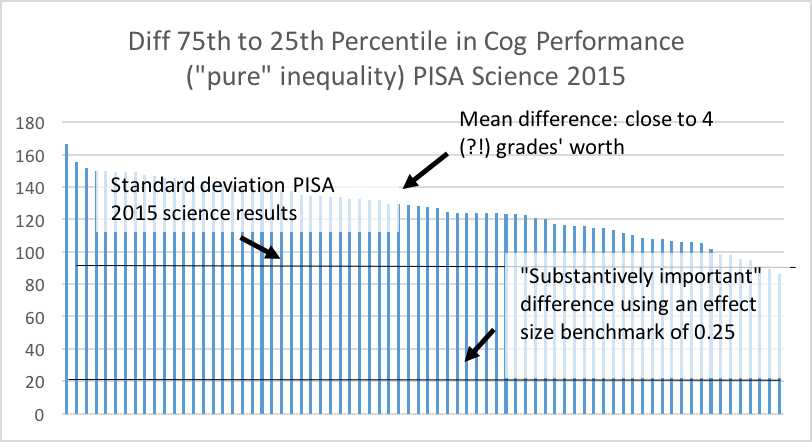
Source: PISA 2015
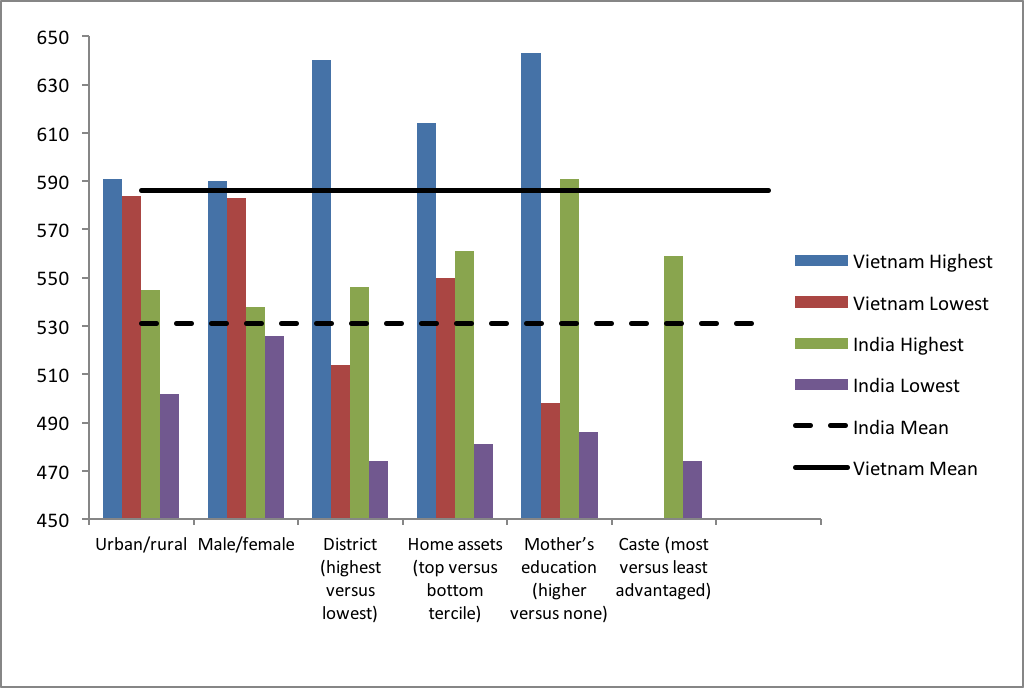
Test score data from Young Lives (equated on a common interval scale) secondary school surveys for pupils aged 14-15 allow an indicative comparison of between- and within-country inequalities.12In Figure 3, scores in maths are compared between lower and higher performing groups within two countries with very similar GDP per capita – India (the states of Andhra Pradesh and Telangana) and Vietnam. It is apparent from the chart that raising girls’ learning outcomes to the average for boys in India could be expected to reduce the performance gap between India and Vietnam by around 20 percent. Raising rural pupils to the level of urban pupils in India would reduce the gap by around 50 percent, while performance among pupils in rural Vietnam would remain very substantially ahead of urban pupils in India. Raising all attainment to the level of the highest performing district in the India sample would have a similar effect, falling considerably short of the Vietnam average. Raising attainment to that of the wealthiest tercile of pupils or to the most advantaged social group (general caste) would close the gap a little further. But only by raising all achievement in India to the level of pupils whose mothers received university education, would attainment reach the average levels of Vietnam. Clearly, children with university educated mothers in both contexts are a comparatively rare and much advantaged group (including in terms of other indicators used here such as household wealth). The implication is that for the most part, horizontal inequalities due to ‘ascriptive’ factors such as gender, wealth, and location, are only a partial explanation for low learning levels, when comparing across countries. Closing some large and important attainment gaps in India (such as by location or wealth) may be expected to reduce the gap with Vietnam by only around half, leaving an equal amount of difference in attainment unexplained between these two systems, using this indicative comparison.13 This issue is explored further in Section 4.
Figure 3 shows the higher attainment of more advantaged pupils in both Vietnam and India is clearly a function of individual child factors plus home advantage and school quality factors. The pattern of school supply in many contexts is such that less advantaged pupils attend poorer quality schools, either in terms simply of resources or in terms of effectiveness, that is ‘value-added’ to pupils’ learning outcomes. In addition, children from disadvantaged backgrounds may also benefit less from the quality of schooling if the impact of school quality is heterogeneous. That is, when compared to their more advantaged peers in the same schools, disadvantaged pupils make less progress as a result of school quality, other things being equal. This potentially leads to a ‘triple disadvantage’ in the form of (i) disadvantaged home background (ii) ‘selection’ into a lower quality schools, and (iii) benefitting less within a school than more advantaged pupils. Differential school effectiveness for different groups of pupils within schools may be the result of discrimination, including linked to institutional features of the system.14 For example, children from ‘lower caste’ backgrounds in India or children whose first language is not the language of instruction in school, may be systematically disadvantaged by the curriculum and/or by teachers’ beliefs and behaviours.
Source: Young Lives
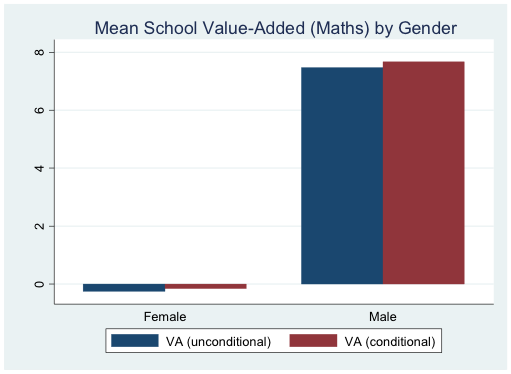
Again using Young Lives data, Figures 4 to 6 below illustrate the relationship between home disadvantage and school effectiveness in maths in India (the states of Andhra Pradesh and Telangana). The bars in Figures 4 and 5 represent pupil-level mean school value added estimates both with and without conditioning on pupils’ backgrounds, grouped by gender and category of mothers’ education. One hundred points on the scale represents one standard deviation on the maths test score scale (roughly equivalent to around three years’ average schooling) so the figure shows that, for example, pupils whose mothers have higher education attend schools which improve pupils’ test scores by up to 0.2 standard deviations more than those whose mothers haven’t been to school.15
Source for Figures 4 to 6: Young Lives Secondary School Survey 2016-17 India (AP and Telangana)
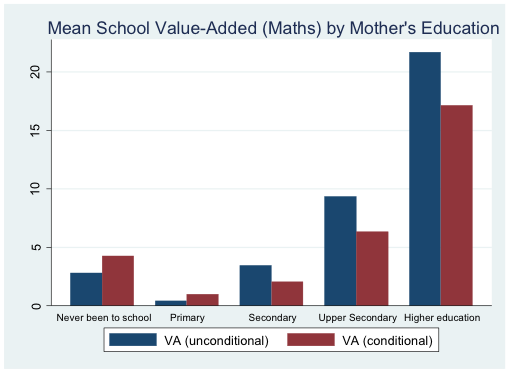
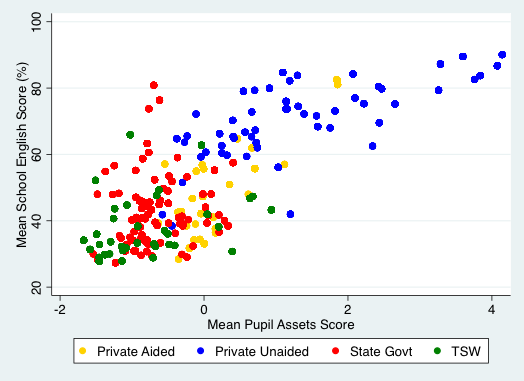
Figure 6 (this time for English) illustrates the more general relationship between pupils’ home advantage and their school-level performance, according to four key school types in India. While there is considerable variation, there is a strong general pattern according to which more advantaged pupils attend higher performing (and especially private unaided) schools. Further, there is greater variation in school performance for schools attended on average by more disadvantaged pupils. This is partly a function of the types of school attended (state government schools are more variable in performance) but it is notable that even within the category of private unaided (and private aided) schools, there is more variance in performance among the schools attended by more disadvantaged pupils. There appears to be no discernible pattern among state government schools, while there are no such schools which are attended, on average, by more advantaged pupils. Moreover, a large proportion of state government schools have lower performance than almost any private school, in part due to their more disadvantaged pupils. Accordingly, disadvantaged pupils in socio-economic terms apparently attend lower performing schools and schools which are less effective, but are also affected by greater uncertainty with regard to school performance.
The figures show that on average boys attend more effective schools (by a small margin), suggesting that ‘school choice’ is operating in favour of boys. In the case of mothers’ education particularly, inequality between pupils’ attainment is being driven substantially by differences in school quality (as well as the individual effects of having more educated mothers), compounding the effects of home advantage. The differences between the bars in these figures do not include the effects of ‘differential school quality’. However, this has been examined using Young Lives data comparing separate ‘school fixed effects’ for advantaged and disadvantaged pupils defined by several criteria at age 11, controlling for a variety of child and household factors including prior attainment (at age 5).16 While there is no apparent evidence that schools in Vietnam are more effective for advantaged students, schools in Peru are found to be more effective for advantaged students whether defined by prior performance or by native language, other things being equal. Specifically, the impact of school effects for Spanish native speaking students when compared to non-native Speakers is 0.22 standard deviations higher in maths and 0.20 standard deviations higher in Spanish.
In common with the results from SACMEQ III and PISA 2015 science, the data suggest that ‘pure inequality’ (between the two countries and between schools based on their effectiveness) is large, especially compared to inequality linked to factors such as gender. Nonetheless, inequalities driven by factors separate from individual and household disadvantage, especially school quality, may compound these inequalities substantially.
In this section we explore whether, in fact, countries seem to improve average learning outcomes by reducing the proportion of children with low achievement or by increasing the proportion with high achievement. We ask whether improvement in averages is empirically consistent with either increasing equality or reductions in ‘absolute’ cognitive skill poverty18 or both and explore whether this depends on the level at which the countries start?
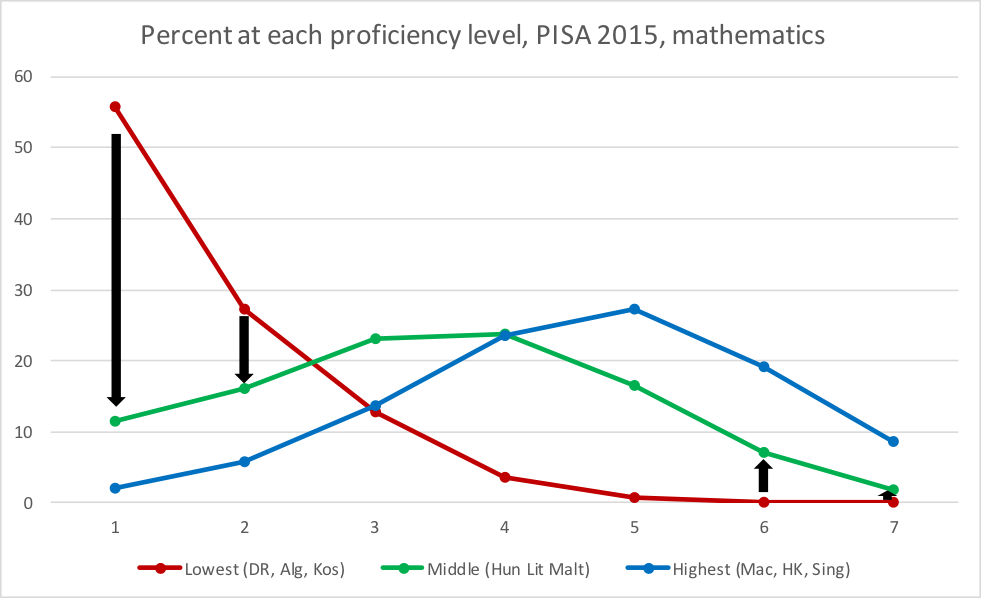
If countries want to improve their average performance, they would seem to have an (implicit) choice: either reduce the percentage of children who have extremely poor performance, or increase the percentage of children who have high performance, or somewhere in between. What does the evidence suggest they do?
The information on this issue is imperfect, because no assessment includes a representative sample of countries in the world. Most of the global assessments contain more high-income and upper-middle income countries than lower-middle income and low-income countries. And few of the very lowest-income or lowest-performance countries participate. There are some regional assessments such as SACMEQ that do include some very low-income countries, but it is not possible to compare this assessment perfectly to the assessments that work in the higher-performing countries. So, all these arguments are imperfect, and will remain so for the foreseeable future.
Nonetheless, with the information at hand, we would argue that in most cases, countries improve their averages from low to middle average performance by reducing the proportion of children with very low performance, and then improve again from middle to high performance by increasing the proportion of children with high performance.19 To justify this statement, we look at cross-sections of countries, not at change over time (a forthcoming Working Paper in RISE will look at this issue). We are assuming that differences between countries at any point in time hold a clue as to how countries progress.
The results for the mathematics assessment in PISA 2015 typify the situation as illustrated in Figure 7. The red line shows the percentage of children at each level of performance, from lowest (1) to highest (7), for the three countries that have the lowest average performance; the green line shows the same thing for the three countries with middle average performance, and the blue line shows the same thing for the three countries with the highest average performance. Notice the large bulge of students, in the lowest-scoring countries, at the left of the distribution. The graph makes it clear that in going from low (red line) to middling performance (green line), countries cut the percentages of children in the two lowest performance levels from about 55 to 10 percent and from 25 to 15 percent, but hardly increase the percentages of children in the two highest levels of performance. 45 percent of children are moved out from the lowest two categories, and less than 10 percent are moved into the top two categories. Only in going from middling to high performance (green to blue lines), countries increase the proportion of children in the two highest performance categories. That is what allows countries to reduce the bulge at the left of the learning distribution.
Source: PISA 2015
But this pattern is not always the case. For example, in the SACMEQ reading assessment, applied in Grade 6 in many Southern and East African countries, we find a similar pattern, but the pattern is much weaker than for PISA 2015 mathematics. Figure 8 shows that in going from low average performance (red line) to middling average performance (green line), there is indeed a drop in the percentage of children at the lower levels of performance, as in the PISA data, but the percentage of children in these lowest levels (in SACMEQ) are not very low to start with (only 35 percent as opposed to 55 percent in PISA), the drop is not very big (only from 35 to 18 percent or so, as opposed to going from 55 to 12 percent in PISA), and there is a simultaneous increase in the proportion of children at high levels of performance (red to green line). This may well be due to SACMEQ simply being an easier assessment for the worst-performing countries involved, than PISA was for the worst-performing countries participating in PISA—one should not read too much into this difference between PISA and SACMEQ. As the table in Appendix 1 will make clear, this SACMEQ III case seems to be more of an exception, rather than the rule.
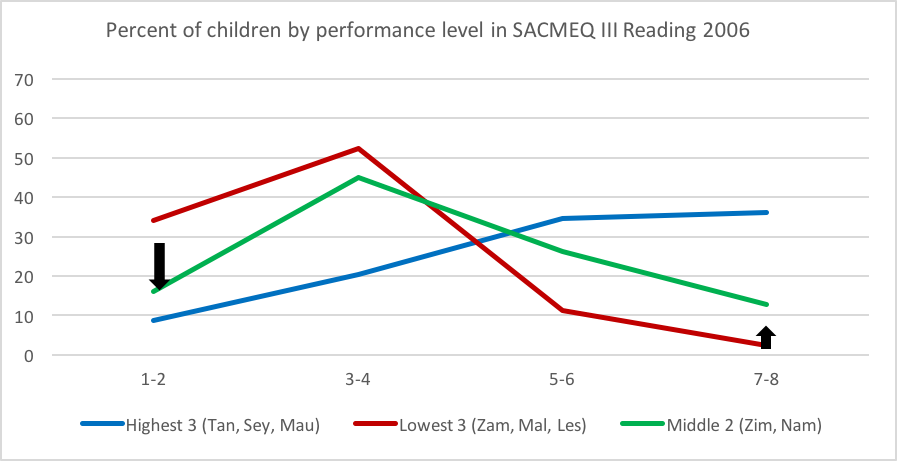
Source: SACMEQ III 2006
Finally, can one decompose the inequality? That is, how much of the inequality in learning achievement seems to exist within countries and how much seems to exist between countries? And, what are some of the implications of whatever we find?
This might seem a bit of an academic question. But it has policy relevance, at least for international development agencies. And, the question is related to the one immediately above. If countries move ‘up’ from the bottom, in terms of average achievement, by reducing the proportion of children with very poor performance, and if a lot of worldwide inequality is within countries, then it seems logical for international development agencies to help countries address, first and foremost, the bottom of their knowledge distributions, as a way of generating more global equality. This is also theoretically consistent with the notions of fairness discussed in section 2 of this note.
This question is even more difficult to answer than the previous one. Nonetheless, we think it is possible to at least get some clues from the data, and develop some preliminary thinking. Part of the problem arises from the fact that the inequality measures that economists have developed for concepts such as income and wealth assume that one is measuring something that comes in ‘natural’ units that have inherent meaning, such as dollars of income per year, dollars of wealth possessed or hectares of arable land owned.20 For these, there is a clear meaning to the concept of zero; earning $2,000 per month is unambiguously twice as much as earning $1,000; the difference between $2,000 and $2,100 is the same as that between $1,000 and $1,100; and so on. This is not the case in the way that the important knowledge assessments construct their measurements. These assessments construct scales of knowledge whose meaning is a great deal more complicated than dollars of income or hectares of land. One could use a more ‘natural’ metric such as percentage of questions answered correctly, but not all questions on these assessments are of equal difficulty. (More or less as if one particular dollar note in one’s pocket had more value than a different dollar note.)
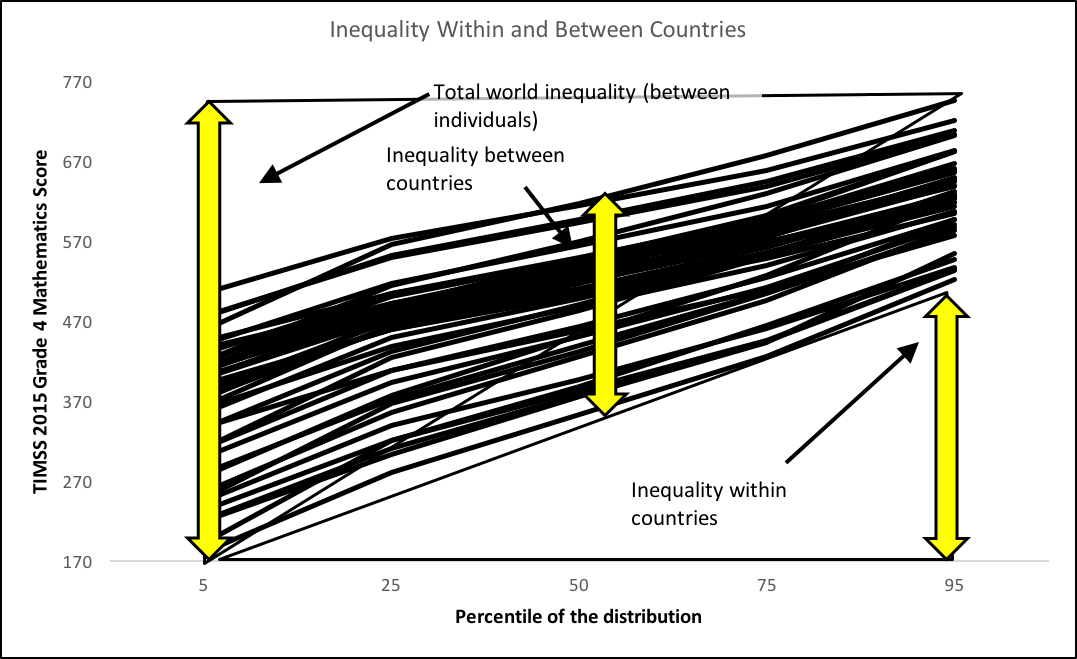
Nonetheless, some intuitively appealing notions of world inequality, and its decomposition, can be derived using the standard assessment results data. Figure 9 on the following page shows, on the vertical axis, the learning outcomes score for children at the 5th, 10th, etc., percentiles of skill in the TIMSS 2015 Grade 4 mathematics assessment. The actual learning outcomes are on the vertical axis, and the percentiles are along the horizontal axis. The percentiles are country-specific. It seems intuitively appealing to consider that the typical difference between countries is the difference between the middle child (at the 50th percentile) in the lower-performing (5th percentile) countries and the middle child in the higher-performing (95th percentile) countries. This is shown by the vertical yellow double-headed arrow at the 50th percentile. The difference within countries, on the other hand, is the difference between the lower-performing (5th percentile) children in the average country and the higher-performing (95th percentile) children in the average countries. This is shown, for the lower-performing country, as the vertical side of the triangle drawn on the lower right-hand side (But in reality, one would take the average of such heights across all countries.). Finally, total world inequality would be the difference in score between the lower-learning child in the lower-learning country and the higher-learning child in the higher-learning country: the left-most double-headed arrow, equal to the side of the triangle with corners are the least-learning child in the least-learning country and the most-learning child in the most-learning country. It would be a convenient result if the difference between countries, added to the difference within countries, summed up to the total difference, by definition or by construct. This is not the case, but the sum is approximately right.
It then turns out that a little more than half (but one could say half, given the inaccuracies and uncertainties involved) of the inequality is within countries, and about half is between countries.
While we are only using TIMSS 2015 Grade 4 mathematics to illustrate this graphically in Figure 9, it turns out that ‘a little more than half of the inequality is within countries’ is true in PISA 2015 reading, mathematics, and science, and in PIRLS 2011, as well as in TIMSS Grade 4 science, Grade 8 science, and Grade 8 mathematics: all of the ‘big’ global assessments. We suspect that if more low-income and low-performance countries participated in these assessments, the inequality between countries would increase more than the inequality within countries, and so the total worldwide inequality would be about half between countries and half within countries.21 It is also likely the case if one takes into account the fact that in the poorest countries many children are not even included in some of the learning assessments, because they are not in school. This could contribute to within-country inequality, and might balance the effect on increasing measured between-country inequality that including such countries might otherwise cause. At the same time, including such countries (if one could impute low levels of learning to those not even in school) would likely reinforce the evidence regarding how progress is made: countries that are increasing access to schooling among the poor are implicitly addressing (some of) the left-hand bulge.22
We carry out these analyses using only the global assessments because the regional ones do not include any high-income countries, and thus would seriously under-estimate the between-country inequality in the world.
Source: TIMMS 2015
Summarising the empirical work behind the graphical analyses and the full information from Table 1 in Appendix 1:
The summary of empirical points above leads to some policy suggestions and areas for further work:
* Please note there is an appendix on the PDF version of this Insight.
1 Most of the results presented here are from published data from Young Lives, PISA 2015, PIRLS 2011, SACMEQ III (2006), TERCE (2013), and TIMSS 2015, requiring nominal extra calculation. Research based on primary data analysis could yield conclusions somewhat different from those presented here. For that reason, we try to use qualitative language, even though all our conclusions are underpinned by numbers.
2 Pritchett, L. and Viarengo, M. (2009) Producing Superstars for the Economic Mundial: the Mexican Predicament with Quality of Education. In: Hausmann, Ricardo and Emilio, Lozoya Austin and Mia, Irene, (eds.) The Mexico Competitiveness Report 2009. World Economic Forum, Geneva, Switzerland, pp. 71-90.; Sandefur, J. (2016). Internationally Comparable Mathematics Scores for Fourteen African Countries. Centre for Global Development Working Paper. Washington, DC: CGD; World Development Report 2018: Realizing the Promise of Education for Development (Concept Note). World Bank Group.
3 Research on Improving Systems of Education Vision Document (2015). RISE Programme. Available at: http://www.riseprogramme.org/sites/www.riseprogramme.org/files/RISE_Vision_document-1 2016.pdf
4 Refers to Amartya Sen (Harvard University) https://scholar.harvard.edu/sen/publications/commodities-and-capabilities
5 In TIMSS 2003, India (selected states) and South Africa were among the lowest performing countries (with South Africa being the lowest of all) as far as average test scores are concerned. Dispersion as measured by the difference between 5th and 95th percentiles of the test score distribution was highest among all participating countries in South Africa and second highest in India – in both cases the 5-95 percentile spread is greater than 300 points [see Das, J., & Zajonc, T. (2008). India Shining and Bharat Drowning: Comparing Two Indian States to the Worldwide Distribution in Mathematics Achievement]
6 Adler, M. J. (1981). Six Great Ideas: Truth, Goodness, Beauty, Liberty, Equality, Justice: Ideas We Judge by, Ideas We Act On.
7 Rawls, J. (1971). A Theory of Justice.
8 Contrasting with a Hobbesian ‘state of nature’ in that the ‘original position’ is a theoretical position behind a ‘veil of ignorance’ and is therefore impartial, whereas a state of nature refers to a state without law or ‘social contract’ in which one is not ignorant of one’s own advantage or otherwise.
9 For example, in Grade 10 national assessments in India (2015) rural pupils scored an average of 247 points compared to urban pupils’ 256 in mathematics overall and in only one state was the urban-rural difference statistically significant. See http://www.ncert.nic.in/departments/nie/esd/pdf/NASSummary.pdf.
10 On economic rents and teachers’ salaries in India, see Pritchett, L., & Aiyar, Y. (2014). Value Subtraction in Public Sector Production: Accounting Versus Economic Cost of Primary Schooling in India. SSRN Electronic Journal.
11 At the risk of being a little technical, whenever we assess ‘strength’ or ‘size’ in this note, we will typically reason in terms of proportions of a standard deviation. This is the most used measure of dispersion of a given set of numbers, such as numbers on learning results. It can be thought of as the ‘typical deviation from the average.’ In any set of learning outcomes, no number is exactly equal to the average. Thus, there is a ‘typical’ deviation of each number from the average. This is a useful benchmark. For example, if the average difference between boys and girls in a test is 10 points, and the average difference between rich and poor in the same test is 50 points, and, in addition, the standard deviation of all the results in that test is 100 points, then 10 is typically judged not to be very large, both relative to the standard deviation, and relative to the fact that the rich-poor difference is 50 points, which would be considered a medium-sized difference. A conventional cut point is that a difference should be about ¼ of a standard deviation to be considered substantively important (or, using jargon, that its ‘effect size’ should be around 0.25). It is now somewhat conventional, also, in using these international assessments, to note (as detailed in PISA’s comprehensive reports) that somewhere around one third to one half of a standard deviation is equivalent to one grade’s worth of difference in learning achievement. Thus, a difference of one standard deviation is a large difference: at least one, two, or possibly three grades’ worth of studies. See OECD. (2016). PISA 2015 Results (Volume I): Excellence and Equity in Education. Paris: OECD Publishing. pg. 65.
12 An international study of childhood poverty. See www.younglives.org.uk.
13 Singh, A. (2014). Emergence and Evolution of Learning Gaps across Countries Panel Evidence from Ethiopia, India, Peru and Vietnam. Young Lives. Available at: www.younglives.org.uk/files/YL-WP124_Singh_learning%20gaps.pdf.
14 In a paper co-authored by a member of RISE’s Intellectual Leadership Team, this notion of a triple disadvantage is foreshadowed. It is noted that in India poor children are more likely to be beaten than rich children, but that the relationship between poverty and the probability of being beaten exists only in public schools. See Desai, S.,Duby, A., Vanneman, R., and Banerji, R. (2009). Private Schooling in India: A New Educational Landscape. India Policy Forum, 2008-2009.
15 Scores are adjusted for age differences between pupils. The mean maths test score in India was 531 points and in Vietnam 586 points, some 0.55 standard deviations higher. In India we estimate average annual progress on this scale to be around 30 points.
16 Glewwe, P., S. Krutikova, & C. Rolleston (2017). Do schools reinforce or reduce learning gaps between advantaged and disadvantaged students? Evidence from Vietnam and Peru. Economic Development and Cultural Change, 65(4).
17 TSW: Tribal and Social Welfare schools are government schools usually located in disadvantaged areas serving tribal and disadvantaged populations.
18 Percentage of children below a certain low–threshold, as in absolute poverty lines.
19 This line of argument is similar to that crafted by the RISE Research Director in Pritchett, L. and Viarengo, M.G. (2009). The Illusion of Equality: The Educational Consequences of Blinding Weak States. Center for Global Development Working Paper 78.
20 These are, to use a bit of jargon, “cardinal” measures.
21 There are several good reasons for this. Average scores are correlated with per capita income, and there are relatively few rich countries that do not participate in international assessments. Also, some of the largest countries in the world are poor, and likely would perform badly (e.g., India, Pakistan, Bangladesh, Nigeria). So, if one weighted these measures by population (as a proper measure of inequality decomposition should, eventually), and if there were more poor countries participating in the assessments, then the between-country differences would likely loom larger.
22 Special thanks to Nic Spaull for higlighting this point during the RISE Equity Panel Discussion on 4 September 2017 in Oxford, England.
23 In any case, the learning gap seems to disfavour boys in more cases than it disfavours girls, whereas in conventional wisdom about education in general, it is girls who are often seen as being at disadvantage. (And it is certainly the case with regard to other key indicators). See also: Kaffenberger, M. and Pritchett, L. (2017). More School or More Learning? Evidence from Learning Profiles from the Financial Inclusion Insights Data. RISE Working Paper.
Crouch, L. and Rolleston, C. 2017. Raising the Floor on Learning Levels: Equitable Improvement Starts with the Tail. RISE Insight. https://doi.org/10.35489/BSG-RISE-RI_2017/004.