Jacobus Cilliers
Georgetown University
Insight Note


How can government and other education actors improve education service delivery? In Tanzania, local public sector officials known as Ward Education Officers (WEOs) play a central role in monitoring the quality of basic education. WEOs are local government officials who have frequent contact with schools and a broad set of responsibilities which includes tracking school improvement, supporting teachers, and collecting school-level information. In recent years, the Government of Tanzania and donor agencies have sought to bolster the role of the Ward Education Officer by providing them with resources, training, and a central role in education programming. For example, the Government of Tanzania’s new School Quality Assurance Framework outlines a key role for WEOs in following up with schools on recommendations stemming from Whole School Visits (school inspections). Part of the rationale for shifting resources and responsibilities to WEOs is the belief that these frontline workers have the relationships, information, and credibility necessary to affect change at the school level.
In this note, we leverage data from a nationwide survey conducted in 2019 to shed light on what WEOs do, their understanding of their own role, and the constraints they face in executing their responsibilities. We interviewed 397 WEOs responsible for primary schools across 23 districts and six regions of Tanzania as part of a baseline survey conducted between February and May 2019. This note contributes to a growing literature on the activities, self-perceptions, and motivation of public sector officials in charge of “last mile” service delivery. For example, Aiyar and Bhattacharya (2016) use time-use diaries, in-depth interviews, and quantitative data to understand the views, attitudes, and activities of sub-district education sector officials, called block education officers, in India.1
In Tanzania, two different ministries are responsible for basic education: the Ministry of Science and Technology (MOEST) leads policy planning efforts while the President’s Office - Regional Administration and Local Government (also known as PO-RALG or TAMISEMI) manages day-to-day school operations and policy implementation. PO-RALG employs officials at the regional, district, and ward level who are responsible for education provision. Wards are sub-district administrative units that encompass between one and several villages. The Ward Education Officer reports directly to a District Education Officer who in turn reports to a Regional Education Officer. Each of these education officials also interacts frequently with the powerful executive of their administrative unit who is also an employee of PO-RALG. At the ward level, this official is the Ward Executive Officer, who oversees all ministry activities within the ward.
In this note, we examine whether WEOs’ self-reported behaviors and views vary by their exposure to a large-scale donor funded programme called EQUIP-T. The Education Quality Improvement Program (EQUIP- T) was a GBP 84.5 million project funded by the UK’s Department for International Development (DFID) which operated in nine regions of Tanzania between 2014 and 2020. The primary aim of the project, which targeted 3.2 million students and 55,000 teachers across 5196 schools, was to improve basic learning outcomes in Tanzania. The programme featured five focus areas:
The project supported Ward Education Officers by providing them with motorbikes and grants, resources that would enable them to conduct more school visits. Beyond receiving additional resources, WEOs in EQUIP-T regions participated in a monthly Continuous Professional Development (CPD) session and trainings on their roles/responsibilities. Another large-donor funded programme in Tanzania called TUSOME (“Let’s Read” in Swahili) also focuses on improving early grade learning. However, since our sample does not include any TUSOME regions of operation, we are unable to examine the impacts of this programme.
Figure 1 shows the fraction of time that WEOs spend on various official activities. WEOs spend the majority of their time (55 percent) visiting schools, a fact which highlights their pivotal role as a frontline monitors. WEOs also spend a considerable fraction of their time writing reports (17 percent), attending meetings (17 percent), and participating in trainings (9 percent).
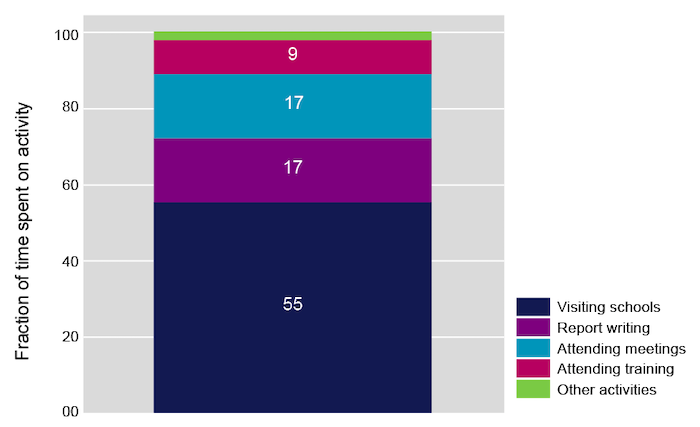
Note: Sample is all WEOs (n=397)
Figure 2 reveals that there is considerable district-level variation with respect to the activities that WEOs engage in during school visits. A high fraction of WEOs in almost all districts report inspecting school documents during their visits. Approximately 75 percent of WEOs in our sample state that they inspect school documents during visits. However, we see much higher district-level variation in other activities such as assessing students. For example, while only 7 percent of WEOs in Rufiji district reported that they assess students, nearly 77 percent of WEOs in Kakonko district do. The large variation between districts suggests that district-level management or other local factors influence WEOs’ behavior. The Government of Tanzania could work to ensure that more WEOs focus on activities that are closely linked with improving learning outcomes such as assessing students, observing teaching, and giving teachers feedback.
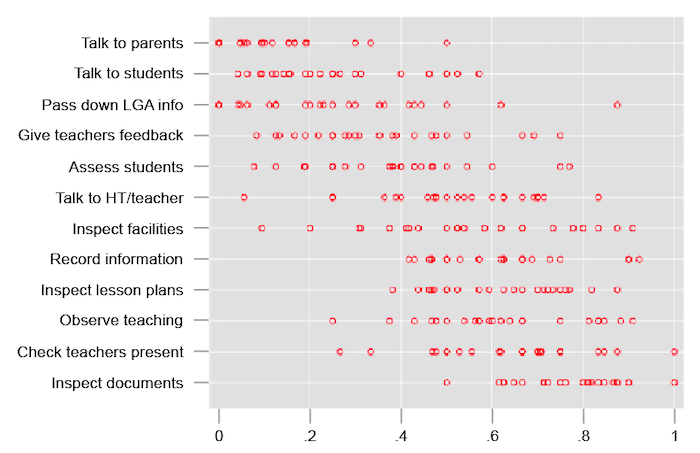
Note: Each dot represents the average fraction of WEOs within a district who reported engaging in the activity during a school visit, n=23 districts
We also examined whether there are differences in the activities WEOs undertake in districts where large-scale donor funded programme, the Education Quality Improvement Program - Tanzania (EQUIP-T), operated between 2014 and 2020. We do not see significant differences in the activities WEOs engage in between districts where EQUIP-T is active and districts where it does not operate.
The survey confirms that WEOs face significant resource constraints. While almost all WEOs in our sample use a government provided motorbike to visit schools (94 percent), less than half (46 percent) have a budget for maintenance or fuel (24 percent). This means that many WEOs pay out of pocket to carry out their official duties. Less than one in ten WEOs have access to a computer. A relatively higher fraction of WEOs have access to tablets (42 percent) but this is largely driven by the presence of the EQUIP-T programme, which distributed tablets to WEOs as part of its activities.
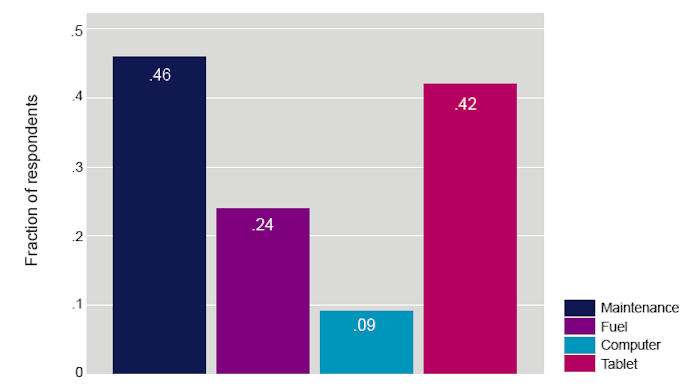
Note: Sample is all WEOs (n=397). Moving from left to right, bars indicate the fraction of WEOs who (i) have a budget for maintenance, (ii) a budget for fuel, (iii) own a computer, and (iv) own a tablet.
We find that the resources that WEOs have access to varies considerably by exposure to EQUIP-T programme. Figure 4 shows that a significantly higher fraction of WEOs in EQUIP-T districts report that their fuel and maintenance budgets are sufficient to complete all of their tasks as compared to their counterparts based in non EQUIP-T districts. Nearly six in ten (59 percent) WEOs in EQUIP-T districts agree or strongly agree with the statement “I have enough resources to perform my job well” compared to 4 in 10 (37 percent) WEOs in non-EQUIP-T districts.
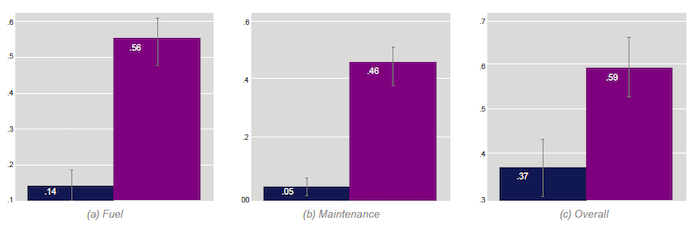
Note: Differences in mean between EQUIP-T (orange) and non-EQUIP-T areas (blue). Panels A, B, and C show the fraction who report to: (i) have a sufficient fuel budget, (ii) have a sufficient maintenance budget, and (iii) agree or strongly agree with the statement “I have enough resources to perform my job well” respectively.
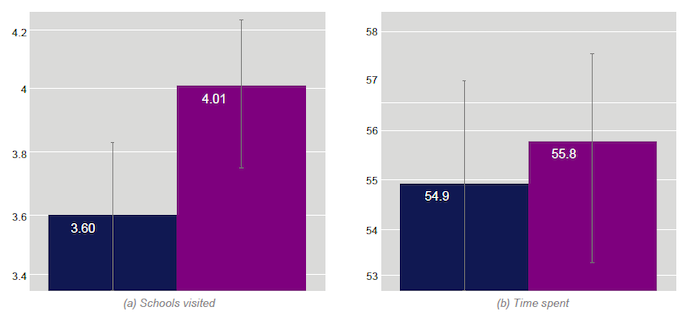
Note: Differences in mean between EQUIP-T (orange) and non-EQUIP-T areas (blue). Panel A shows the number of schools WEOs reported visiting in the past two weeks (n=397). Panel B shows the fraction of WEOs’ overall time spent visiting schools (n=394).
Our findings suggest that the additional resources provided by EQUIP-T resulted in more WEO school visits. Figure 5 shows that WEOs in EQUIP-T areas visited .4 more schools on average over a two-week period compared to their colleagues in non EQUIP-T areas, an 11 percent difference. If this difference persisted over the course of a year, WEOs in EQUIP-T areas would conduct approximately 8 more school visits than their non-EQUIP-T colleagues. WEOs in EQUIP-T areas do not spend a significantly greater fraction of their time visiting schools (Figure 5b), a finding which suggests that perhaps they may be using their time more efficiently (conducting more school visits within the same amount of time).
Figure 6 shows that WEOs are quite satisfied with many aspects of their role including their location, the support they receive from the Directorate, and the job stability that the position offers. However, relatively fewer WEOs are satisfied with their promotion opportunities or their salary. About three quarters of WEOs (73 percent) are somewhat or very satisfied with their opportunities for promotion and just over half of WEOs (57 percent) are somewhat or very satisfied with their salary. Only one in ten WEOS (9.3 percent) are very satisfied with their salary.
The less than universal satisfaction with promotion opportunities may be driven by the limited scope for advancement either within the rank of WEO or beyond the District Education Officer level. More than half of WEOs (57 percent) suggest that they would like the position of DEO within 5 years if everything goes according to plan and few report aspirations beyond the DEO level. To improve WEO satisfaction, the government could consider raising their salaries and creating more professional advancement opportunities for WEOs.
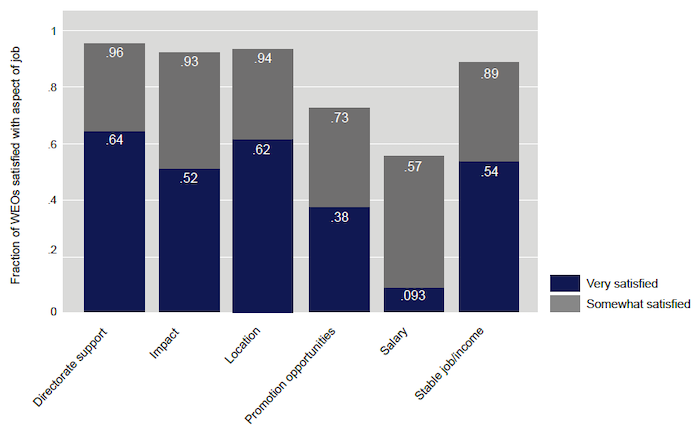
Note: Sample is all WEOs. Length of the green and grey bars indicate the proportion who are very satisfied and satisfied respectively. Moving from left to right, the job aspects are: 1) Support from the District Directorate; 2) Opportunity to make a positive impact; 3) Current Job Location; 4=Opportunities for Promotion; 5) Current Salary; 6=Having a stable job and income
We asked WEOs whether they agree or disagree with various statements about their role. The findings show that a high fraction of WEOs believe they have authority and discretion in their role. For example, 93 percent agree or strongly agree with the statement “My work colleagues and I have enough authority to complete our work successfully” and 95 percent agree or strongly agree with the statement “My work colleagues and I are granted enough discretion and autonomy to complete our tasks.” WEOs’ assessment of themselves as autonomous actors within the bureaucracy differs from that of similar officials in other developing country contexts. In their study of block education officers in India, Aiyar and Bhattacharya (2016) find that the officers “primarily view themselves as cogs in a wheel”. Although many WEOs are satisfied with their autonomy and decision-making power, fewer have a favorable view of the rewards they receive. Only six in ten WEOs agree or strongly agree with the statement “I am rewarded by my manager when I perform well”. This suggests that there is room for government to build a better reward system for high-performing WEOs.
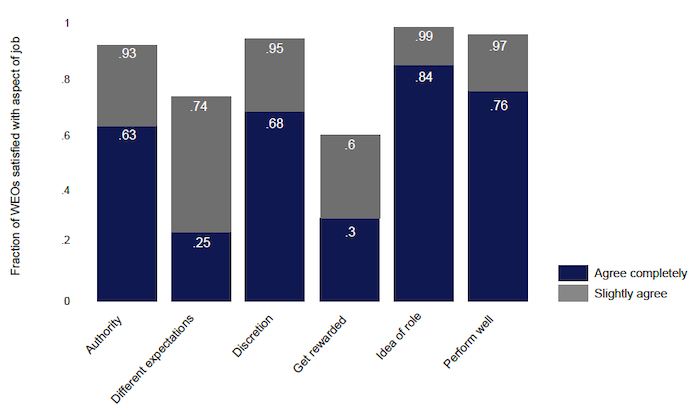
In Figure 7, moving from left to right, the statements are: 1) My work colleagues and I have enough authority to complete our work successfully; 2) I find it difficult to complete all my tasks because different people expect different things of me; 3) My work colleagues and I granted enough discretion and autonomy to complete our tasks; 4) I am rewarded by my manager when I perform well; 5) When my work colleagues and I arrive at work everyday we have a good idea of what our roles and expectations are and what the DEO expects of us; 6) My manager knows when I am performing well and when I am not performing well.
Nearly three quarters of WEOs (74 percent) agree or strongly agree with the statement “I find it difficult to complete my tasks because different people expect different things from me.” This finding suggests that WEOs have multiple principals who exert competing demands on them. WEOs are officially mapped to the President’s Office - Ministry of Local Government, the ministry in charge of day to day management of education. However, they may be subject to demand from local officials such as Ward Councillors and requests from the ministry in charge of education sector policymaking, the Ministry of Education, Science and Technology (MOEST).
While WEOs have a positive view of many aspects of their role, they are less satisfied with their opportunities for promotion, salary, and rewards as well as the fact that they face demands from multiple actors within the system.
Cilliers, J. and Oza, S. 2020. The Motivations, Constraints, and Behaviour of Tanzania's Frontline Education Providers. RISE Insight Series. 2020/023. https://doi.org/10.35489/BSG-RISE-RI_2020/023