Rukmini Banerji
RISE Intellectual Leadership Team
Insight Note

The COVID-19 pandemic led to a sudden and prolonged closure of schools globally. While it was well known that there was a “learning crisis” for elementary school children, at least in countries of sub-Saharan Africa and in South Asia,1 the COVID-19 related school closures have deepened concern that “learning loss” is inevitable and likely to be substantial. Much of the existing research on “learning loss” is connected to what children lose in summer holidays. This literature is largely from the United States and other western countries. There are also analyses of the long run impact of disasters on children’s learning levels in developing countries (for example, the recent Andrabi et al RISE Working Paper on the aftermath of the Pakistan earthquake is a good example of such work).
In India, as well as globally, there is widespread concern that economic hardships faced by families will have consequences for children’s schooling in terms of disruption and discontinuities. In addition, the worry about “learning loss” is shared by households, communities, and governments. The fact that basic learning levels were worryingly low before the COVID crisis and that further “learning loss” may be significant adds to the deepening concern about an already inequitable situation widening divides: disadvantaged children suffering further disadvantage. As we look forward to reopening schools and to start planning for what to do immediately after schools open, many questions come to mind: Is there data about “learning loss” and “learning gain” available for India that can guide our planning? More specifically for our context:
Finding relevant evidence and connecting to appropriate experiences are both essential if we are to chart future plans in a realistic way. This note is an attempt to answer these questions using available data from Uttar Pradesh (India’s largest state). Children lose quite a bit over the summer months and hence the losses from extended COVID shutdowns are likely to be substantial. The gains from a typical year of schooling in Uttar Pradesh are modest. But there is optimism, as dedicated programmes focused on foundational learning—implemented in government schools at scale—can lead to the equivalent of a typical year of learning in just three months.
Two sources of data may be useful as we begin to look for patterns of “learning loss” and “learning gain”. First is data from the Annual Status of Education Reports (ASER).2 For over a decade (2006 to 2018) ASER data provides estimates of children’s basic learning levels for almost all rural districts of India. Each child is given a simple set of reading tasks. The assessment is done one on one and orally. Can the child read letters, common words, simple four sentence paragraph (Grade I level text) or a basic eight-ten sentence “story” (text at Grade II level)? Reading tasks are available in the languages of the medium of instruction in the state. The child is marked at the level at which she can read comfortably. All children from age 5 to age 16 (regardless of grade) are given the same reading tasks.3 The sample size in ASER is large. Nationally, more than 300,000 families are reached and over 600,000 children are surveyed in every round of ASER. 4
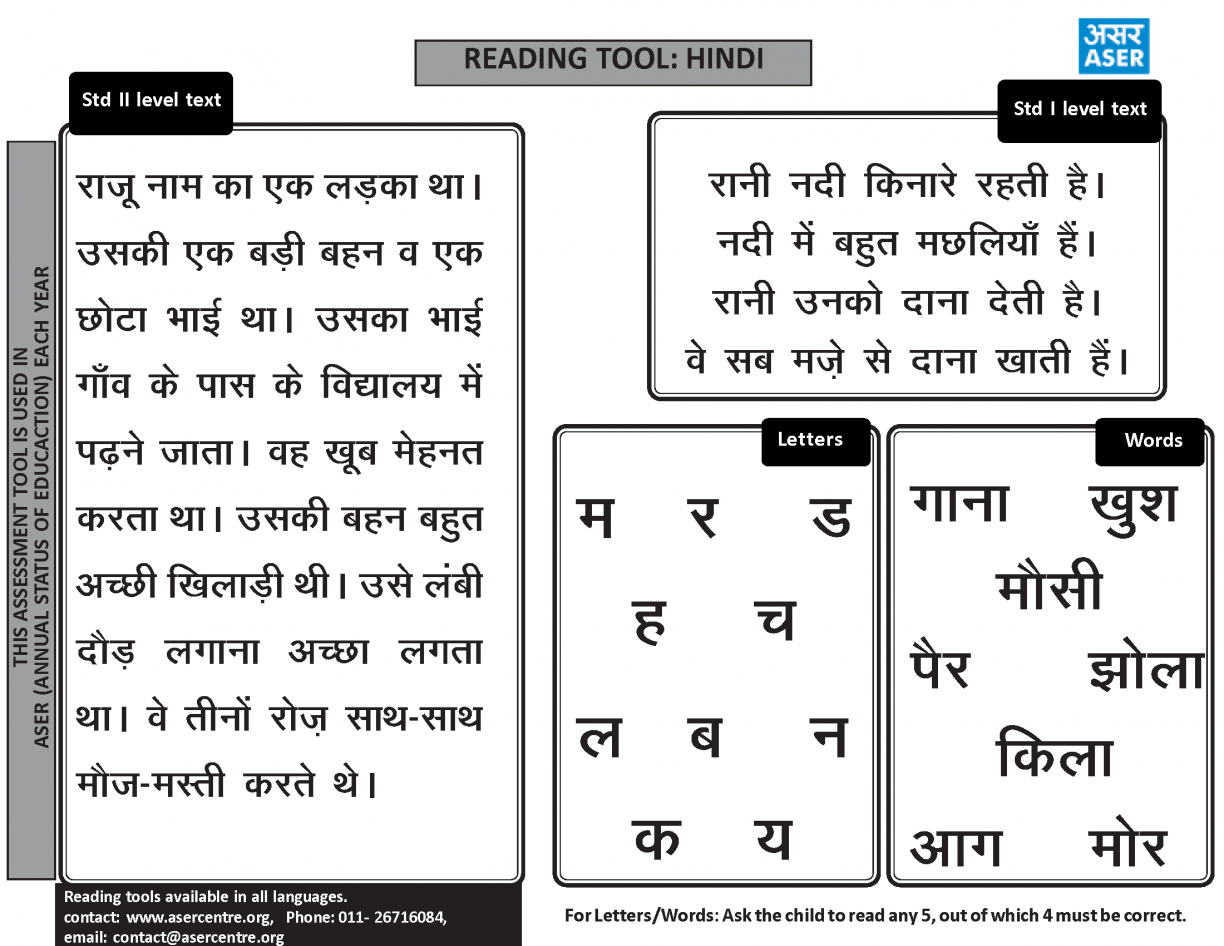
ASER Tool in Hindi
Another possible source of data is available for Uttar Pradesh—India’s largest state. In the 2018-19 school year, the Uttar Pradesh government, in partnership with Pratham, conducted a foundational learning improvement intervention called “Graded Learning Program” (GLP). Covering all government primary schools across the state, the aim of the programme was to improve the basic reading and arithmetic levels of children from Grades I to V. The programme was designed and implemented using the key elements of Pratham’s tried and tested “Teaching-at-the-Right-Level” instructional approach.
The roll out of the GLP programme happened between January and February 2019 and continued until summer vacations started in May of that year. Before starting the instructional programme, in each school, teachers assessed children one on one using the simple ASER tool for reading and for arithmetic. Baselines were done from January to February 2019 and end lines from late April to early May 2019. Baseline and end line data was available for all schools in all 75 districts in the state. Additionally, in anticipation of GLP re-starting in the new 2019-20 academic year, many schools did a new baseline with their primary school children in August 2019. In approximately 22 districts, more than 80 percent of schools uploaded their new baseline data. The availability of data from these 22 districts (for about 1.5 million children) provides an opportunity to assess the scale of the “summer” learning loss in these locations.
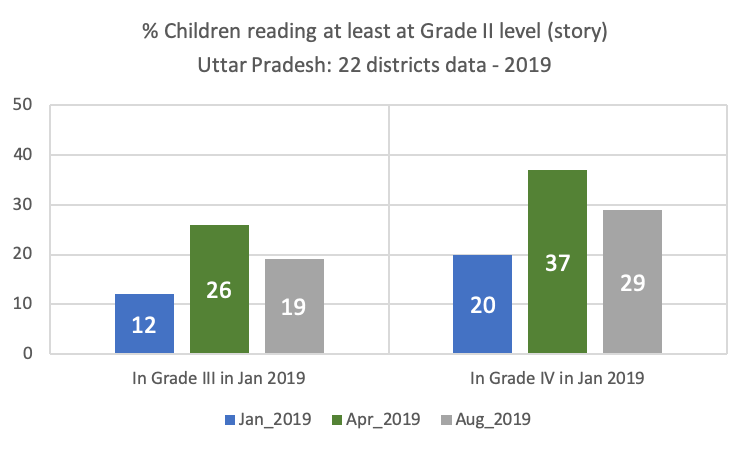
It should also be noted that in the period prior to the summer, during the implementation of the GLP, the percentage of children reading fluently at least at Grade II level rose by 14 to 17 percentage points for children in Grades III and IV. It is also worth underlining that even after this increase, by the end of Grade IV less than 40 percent of children were reading at least at Grade II level.5
Also, suppose the learning loss is linear with time. Losing 7 percentage points over three months suggests 21/3 percentage points per month which means that if schools closed two months early, the effective “summer” break was five months instead of the usual three. The cumulative loss (on these simple assumptions) would be 11.6 percentage points and only 26 - 11.6 = 14.4 percent of those starting Grade IV would be able to read at a second-grade level, much lower than “expected” from a usual summer break.
Data on trends over time from ASER can be useful in estimating “usual” year on year learning gains. Let us ask the question: In the last ten years, in government primary schools in India, how much do children gain in reading ability between one school year and the next? To answer this question let us go to ASER data for the state of Uttar Pradesh for the past decade.
Based on ASER data for Uttar Pradesh, analysis of year on year learning gain figures for the period 2012 to 2018 shows two broad trends (for the numbers and details see Annexure 1). First, the gains for this reading level are relatively lower in early grades as compared to the year on year gains in reading in higher grades. For example, for children moving from Grade II to Grade III to Grade IV, at least in the period up to 2016, depending on the years in question, we can see learning gains in being able to read at Grade II level ranging between 5 and 10 percentage points. Whereas for children moving from Grade VI to Grade VII to Grade VIII, the proportion of children reading fluently (at least at Grade II level) increases by 10 to 15 percentage points a year. Secondly, in more recent years, particularly between 2016 and 2018, year on year gains have been higher for all grades as compared to similar grades in previous years.
Given the analyses in the previous section, we should remember that the year on year calculations are based on ASER measurements that are done each year around October. Hence these figures include not only some gain during the school year, but also some loss in the vacations.
If the “usual” (higher end) patterns of year on year learning gains are gains between 10 and 15 percentage points, then what should have been the basic learning levels in Uttar Pradesh during the current school year 2020-21 if COVID-19 had not happened? Table 1 shows rough estimates of learning levels we would have seen by October 2020 based on past trends and the optimistic assumptions of 10 and 15 percentage point gains, if 2020-21 had been a usual school year. Even with a 15 percent year-on-year gain assumption, slightly more than half of all children in government schools in Uttar Pradesh would still not be reading at least at Grade II level. These projections underline the urgent need for helping children acquire foundational skills (like basic reading and arithmetic) even if it had been a normal year.
Table 1: Estimated learning levels for 2020: Uttar Pradesh government school children. (Projections based on past ASER trends for UP).
| Percentage of children reading at least at Grade II level: Data from ASER 2018 | What percentage of children would be reading at least at Grade II level in 2020 two years later? Based on projections | Assuming 10 percentage point gain per year | Assuming 15 percentage point gain per year | |||
|---|---|---|---|---|---|---|
| Grade III in Oct 2018 | 12.3 | to | Grade V in Oct 2020 | ? | 32.3 | 42.3 |
| Grade IV in Oct 2018 | 23.8 | to | Grade VI in Oct 2020 | ? | 43.8 | 53.8 |
| Grade V in Oct 2018 | 36.2 | to | Grade VII in Oct 2020 | ? | 56.2 | 66.2 |
The government’s focussed learning improvement programme in Uttar Pradesh (GLP) was implemented for roughly three months towards the end of the 2018-19 school year. Depending on the pace of the rollout in each district, instructional time at school level ranged from a minimum of 45 days to 70 days of at least 2-3 hours per day devoted to building foundational learning skills of reading and arithmetic. Based on key elements of Pratham’s “Teaching-at-the-Right-Level” approach, children in Grades III, IV, and V were grouped by their level of reading and arithmetic rather than by their grade. Approximately Rs 1000 worth of extra material for each school was printed for Grades I to V (a little over Rs 5 per child—at current exchange rates this is less than 7 US cents per child) which included stories in large font, syllable charts, practice reading cards, and word problem booklets. Appropriate activities were done by teachers with each group to help children make progress to the next group. Frequent reviews at school, block, district, and state level were conducted, even in this short period of time.
It is worth comparing how much “learning gain” was visible and possible during this short but focussed intervention as compared to the “learning gain” in a typical “business as usual” year.
Table 2. Data from Uttar Pradesh government programme (GLP). All districts: Learning gains in 3 months in 2019
| Percent of children reading at least at Grade II level (Approx 1.6-1.7 million children tested in each grade) |
|||
| Baseline | Endline | ||
| Grade III in Jan 2019 | 13.4 | Same cohort in May 2019 | 27.4 |
| Grade IV in Jan 2019 | 21.9 | Same cohort in May 2019 | 38.0 |
Table 2 provides an interesting contrast between what is “business as usual” (from the previous section) and what is “possible”. Table 2 shows gains in reading of 14 percentage points in Grade III and 16.1 percentage points in Grade IV. This occurred in a three-month period when a focussed intervention for acquiring foundational skills was implemented in a determined manner by the state government. Note that this data shows that a typical learning gain from a year’s worth of schooling is possible in three months. If the same high priority push had started in the beginning of the school year and been continued for a longer period of time, a more substantial rise may have been visible.6
The gain we see with the Graded Learning Program between January and May of 2019 is equal to the year on year gain normally seen. The “business as usual” model (estimated using annual ASER data) assumes no special learning improvement effort and incorporates the learning loss seen in the summer months. Therefore, if a focussed effort for strengthening basic reading and arithmetic is initiated as soon as schools open this year (whether in August or September or even later) and if the focussed effort is sustained in a determined fashion until March, we should be able to see significant improvements in foundational skills. By maximising possible learning gains, and minimising learning losses, it is possible that the 2020 school year could turn into a solid year for building foundations.
This promising possibility of “learning gains” must be taken into account as plans are made for the way forward beyond the COVID-19 crisis.
What can we anticipate when schools reopen? In the case of Uttar Pradesh, two important points to keep in mind from recent experiences:
These two facts point to a clear direction for future policy and practice. A strong concerted effort on foundational skills–basic reading and arithmetic–is needed as soon as schools open and attendance stabilises. Helping children who have fallen behind to “catch up” is the single most important act for effectively addressing concerns about equity.
Schools may not open for another three months at least. Even once they open, it will take time to settle down to a regular routine. So, it is better that we do not worry or be in a hurry about grade level curriculum and instead use the remaining time–anywhere from three months to six months–to build the momentum for strong foundational skills. The opportunity provided by the announcement of the National Mission for Foundational Literacy and Numeracy makes this a perfect time to build on experiences with foundational skills that exist in the state. The evidence discussed here for Uttar Pradesh can provide important inputs for planning in other states of India.
The Annual Status of Education Report (ASER) initiative began in 2005. The aim was to reach a representative sample of children (age 3 to 16) in every rural district in India every year.7 It has been done every year between 2005 and 2014 and since then it has been done every alternate year (2016, 2018). Data from ASER can be useful for looking at
Table A: Percent of children reading at least at Grade II level (“story” level): Uttar Pradesh children enrolled in government schools. Data from ASER 2012 to 2018. (No ASER was conducted in 2015 and in 2017).
|
|
2012 |
2013 |
2014 |
2015 |
2016 |
2017 |
2018 |
|---|---|---|---|---|---|---|---|
|
Grade II |
2.2 |
2.3 |
1.9 |
|
3.2 |
|
4.6 |
|
Grade III |
6.5 |
7.1 |
6.0 |
|
7.2 |
|
12.3 |
|
Grade IV |
14.1 |
17.1 |
15.2 |
|
15.9 |
|
23.8 |
|
Grade V |
25.6 |
24.5 |
26.8 |
|
24.3 |
|
36.2 |
|
Grade VI |
37.6 |
39.9 |
38.5 |
|
34.7 |
|
45.1 |
|
Grade VII |
48.9 |
50.1 |
52.1 |
|
49.5 |
|
55.3 |
|
Grade VIII |
57.3 |
57.6 |
59.3 |
|
56.3 |
|
62.0 |
This table can be read in several ways: if you move down a column, you can see reading levels by grade in that year. If you from left to right in a row, it shows the reading level for that grade over time. Moving down a diagonal is following a cohort over time. For example: moving across the Grade V row from left to right shows that between 2012 and 2016, roughly a quarter of all children in government schools could read at least at Grade II level. This percentage for Grade V went up to 36 percent in 2018. Another example, if you move down the 2018 column from top to bottom, you can see that 36.2 percent of children in Grade V can read at least at Grade II level whereas the similar figure for Grade VIII is 62 percent. Finally, let us follow a cohort over time. The light blue diagonal follows children who were in Grade II in 2012 until they reach Grade VIII in 2018. In 2012, only 2.2 percent of children were at Grade II level. In 2016, the cohort was in Grade VI with 34.7 percent of children reading at least at Grade II level and in 2018, 62 percent of children in this cohort were reading at least at Grade II level.
Based on data from Table A, Table B shows the year on year “usual learning gain” for children enrolled in government schools in the state of Uttar Pradesh. For years when ASER was not conducted, data has been used for the previous year and the subsequent year for estimating the learning gain that happened for the year there is no data. For example, let us follow the cohort who were in Grade II in 2012 and reached Grade VIII in 2018. For this cohort, in Grade IV, 15.2 percent of children were reading at least at Grade II level. This percentage increased to 34.7 percent by the time the cohort reached Grade VI in 2016. In two years, from 2014 to 2016, there had been a 19.5 percentage point gain increase (34.7 - 15.2 = 19.5). Dividing this gain evenly across the two-year period indicates that there may have been a gain of about 9.7 percentage points annually. Perhaps this is early evidence of the state’s ability to raise, what economist Lant Pritchett calls, the “pedagogical production function”.
Continuing with this cohort, it is clear that there were “usual year on year learning gains” between 5 to 10 percentage points each year until they reach Grade IV after which the annual learning gains are closer to 14 percentage points.
Table B: Percentage point increase year on year for different cohorts over time for those reading at least at Grade II level. Uttar Pradesh children enrolled in government schools. Data from ASER 2012-2018.
|
|
2012 |
2013 |
2014 |
2015 |
2016 |
2017 |
2018 |
|---|---|---|---|---|---|---|---|
|
Grade II |
Start |
Start |
Start |
|
Start |
|
|
|
Grade III |
Start |
4.9 |
3.7 |
7.0 |
Start |
10.3 |
|
|
Grade IV |
Start |
10.6 |
8.1 |
9.1 |
7.0 |
14.5 |
10.3 |
|
Grade V |
Start |
10.3 |
9.7 |
9.7 |
9.1 |
14.6 |
14.5 |
|
Grade VI |
Start |
14.3 |
14.0 |
11.4 |
9.7 |
15.5 |
14.6 |
|
Grade VII |
|
12.6 |
12.2 |
8.9 |
11.4 |
13.7 |
15.5 |
|
Grade VIII |
|
|
9.1 |
|
8.9 |
|
13.7 |
Overall, two broad patterns are visible. First, as a cohort moves from a lower grade to higher grade (for example: Grade II to III to IV), the gains for Grade II level of reading are typically between 5 to 10 percentage points year on year. However, as the cohort moves to higher classes (for example: Grade VI to VII to VIII) the annual gains are higher between 10 and 15 percentage points for each year. Secondly, in the case of Uttar Pradesh, we can see that in later years, particularly between 2016 and 2018, the annual learning gains across all grades have been higher than in most preceding years. This suggests that the system is getting better at raising overall learning levels.
1 World Development Report 2018
2 All ASER reports and tools are available on www.asercentre.org
3 ASER 2006 to 2018. All reports, tools and details about testing can be found on www.asercentre.org
4 This sample is much larger that the Indian government’s (National Sample Survey Organizations NSSO) samples of households which are used for tracking for key socio-economic indicators for the country including estimates of poverty.
5 Similar trends are visible for children’s arithmetic skills as well.
6 Having timely assessment data, which was easily understood, available at each assessment cycle as well as facilitated discussions about children’s learning improvement and comparisons with neighbouring schools, clusters, blocks and districts also helps to fuel progress.
7 The 2005 sample covered the age group 6 to 14 but in subsequent years the age group sampled was 3 to 16. Children in Grade I to Grade VIII are assessed on basic reading and arithmetic. Enrollment data for all children age 3 to 16 is also collected including the type of school or pre-school they attend.
Banerji, R. 2020. Learning “Loss” and Learning “Gain” in Primary School Years: What Do We Know from India That Can Help Us Think Forward in the COVID-19 Crisis?. RISE Insight Series. 2020/019. https://doi.org/10.35489/BSG-RISE-RI_2020/019