
Deon Filmer
World Bank
Insight Note
This RISE Insight Note summarises highlights from:
Filmer, Deon, Ezequiel Molina, and Waly Wane. 2020. “Identifying Effective Teachers: Lessons from Four Classroom Observation Tools” RISE Working Paper 20/045.
Teachers explain a significant share of variation across students’ achievement (Araujo et al. 2016, Bold et al. 2019; Dobbie and Fryer 2013). But these achievements are poorly correlated with teachers’ observable characteristics including age, gender, education, experience, and hours in the school (Aaronson et al. 2007; Kane and Staiger 2008; Rockoff et al. 2008). This suggests there could be other factors such as teachers’ content knowledge, pedagogical knowledge, classroom behaviour, and other practices that are potentially important determinants of students’ academic performance. There is growing interest in understanding these factors and exploring how they impact student learning. This has led to an increase in the development and use of structured classroom observation tools to observe, analyse, and measure teaching and learning practices within classrooms. These tools have provided information on current teaching practices and improvements over time.
There are a number of studies that have implemented classroom observation tools to understand determinants of student learning and successful classroom behaviours and practices. But few studies have compared across these tools, and even fewer have attempted such comparisons in low- and middle-income countries.1 This study aims to examine the internal properties of these tools, understand the similarities and differences in the behaviours and practices captured by each tool, and assess their effectiveness at predicting student achievement. In addition to generating insights on the tools themselves, this study seeks to contribute to the design of better policies and programmes for teacher recruitment and training and for classroom management.
Our sample includes 106 primary schools from across four regions in Tanzania. These were drawn from a national sample of schools surveyed for the Service Delivery Indicators project (Martin and Wane 2016). On average, our schools had 14 teachers and a class size of 58 enrolled students. While features such as a readable blackboard and chalk were common in the schools, functioning electricity was rare, especially in rural areas. Only around a third of the classrooms in the sample had student work or other charts displayed on the walls. Availability of books for reading was extremely limited. On the day of an unannounced visit, 14 percent of teachers were absent from the school, and 39 percent of teachers were not in the classroom. It is in this setting that we aim to reliably identify effective teachers and teaching practices.
We compared four classroom observation tools in this study: the Service Delivery Indicators (SDI), the Stallings Classroom Observation System (Stallings), the Classroom Assessment Scoring System (CLASS), and the Teach Classroom Observation Tool (Teach).
Key features of these tools are summarised in Box 1.
| Administration | Time-on-task | Areas of focus | |
|---|---|---|---|
| SDI | In-person | Yes | Checklist of observed teacher behaviours, availability and use of materials, and classroom infrastructure. |
| Stallings | In-person | Yes | Checklist of classroom environment, and of materials and infrastructure availability. |
| CLASS | Video | No | Rater scoring across various dimensions grouped into 3 domains (Emotional support; Classroom organization; Instructional support) plus rating of Student Engagement. |
| Teach | Video | Yes | Rater scoring across various dimensions grouped into 3 areas (Classroom culture; Instruction; (promotion of) Socioemotional skills. |
In Box 1, “administration” indicates how data was collected for each tool. The SDI and Stallings tools2 use trained, in-person enumerators to record what they see in a classroom in the form of a checklist of pre-populated categories.3 Because these enumerators did not have to interpret much of what they were observing, the SDI and Stallings are regarded as “low-inference” tools. Our implementation of the CLASS and Teach tools rely on classroom videos. Cameras were set up in classrooms to video record lessons. These videos run the entire length of the lesson and were subsequently divided into two or three clips of around
20 minutes each. These clips (coded using both the Classroom Assessment Scoring System4 as well as the Teach scoring system5 ) are studied by trained observers who map and score specific behaviours and practices.6 These observers are required to make consistent qualitative judgements, so the CLASS and Teach tools are considered as “high-inference” approaches. This mix of low- and high-inference tools in our study allows us to compare across different formats of data collection while gathering information on an array of measures.
The column titled “Time-on-task” in Box 1 indicates whether the tool captures a time-on-task measure, which is the amount of time that a class is engaged in active instruction. Three of the tools (CLASS is the exception) capture this information. Each of these tools define teaching in a unique way and also capture time-on-task in a unique way. For SDI, an enumerator observes a full lesson and records minute-by-minute what the teacher does against a set of predefined activities (such as “Teacher interacts with all children as a group” or “Teacher in class - not teaching”). Every five minutes, the enumerator also carries out a spot-check and records the number of students who are “off-task.”7 In the Stallings tool, an entire lesson is observed by an enumerator who records 10 “classroom snapshots” that are evenly spaced over the lesson time. At the time of each snapshot, the enumerator visually scans the room clockwise and records what the teacher is doing and how many students are engaged in that task, as well as what students who were not engaged in the task are doing.8 Teacher activities include items such as “reading,” “discussion,” or “disciplining students,” while other activities the other students could be doing include “social interaction” and “uninvolved”. The Teach protocol also captures time-on-task. Every five minutes within the first 15 minutes of the video clip, the rater takes a snapshot of the activities and records whether the teacher is engaged in teaching activities or has provided a learning activity for most students. If yes, then the rater also records how many students are “on-task,” which is reported as low (6 or more students are off-task), medium (2-5 students are off-task), and high (all students are on-task, with allowance for 1 student to be off-task).9
The column titled “Area of focus” in Box 1 provides a brief description of the other dimensions on which data is collected by each tool.
Since our objectives were to investigate the internal properties of these tools and compare across tools, we chose for some classrooms to have two enumerators with the same tool and for some classrooms to have two enumerators with a different tool. In the first round of data collection, Grade 4 classrooms were assigned to either having two SDI enumerators (27 schools), two Stallings enumerators (27 schools), or one SDI and one Stallings enumerator (46 schools).10 In addition, some classrooms were assigned to having a video camera (65 schools). In each of these schools, the two enumerators were subsequently supposed to observe an additional classroom by themselves—targeting a Grade 3 and a Grade 5 classroom. Therefore, in this first round of data collection, a set of Grade 3 classrooms were observed using SDI only (46 schools), Stallings only (45 schools), and SDI and Stallings (2 schools); and a set of Grade 5 classrooms observed using SDI only (41 schools), Stallings only (52 schools), and SDI and Stallings (2 schools).11 Grade 3 and 5 observations did not include video cameras. Four months later, in round 2, all Grade 4 classrooms were supposed to be observed using SDI and Stallings, along with a video camera. The resulting sample included classrooms that did indeed follow that model (84 schools). However, due to technical and coordination issues in the field, videos were not done in some classrooms (9 schools). Further, some schools were not reached and there is no round 2 SDI, Stallings, or video for these (11 schools). But two schools that had not been reached in round 1 were reached and included in the sample.
We complemented the classroom observation data by collecting test scores for teachers and students. Teacher scores were derived from a test administered as a part of the national SDI survey.12 For the purpose of our analysis, we included scores of Grade 4 teachers whose classrooms were observed in our study. Teachers and students were tested for content knowledge in mathematics, Kiswahili, and English. The mathematics test for teachers was pegged at Grade 4 but the language tests were pegged at a higher grade. Student tests were curriculum-based, pegged to the Grade 3 and early Grade 4 curriculum, and were developed by Tanzanian education academics in collaboration with the research team. Students were tested twice in four months, and the average score was used in our analysis.
This next section presents our analysis and key findings. First, we discuss summary statistics and findings that shed light on the internal characteristics of the classroom observation tools. Next, we discuss cross-tool comparisons, and finally, we examine our findings on how these tools relate to student test scores.
As part our analysis, we constructed two variables using the time-on-task data that was captured by SDI, Stallings and Teach. The first was “Share of Time Teaching” and the second was “Share of Time Teaching and Learning”. Share of Time Teaching was simply the share of minutes in which the teacher was recorded as engaged in teaching activities. Since teaching is defined in specific ways in these tools, this variable was constructed differently for each of the three tools that captured time-on-task. For SDI, Share of Time Teaching is the minutes in which the teacher was recorded as engaged in teaching activities divided by the total class time. For Stallings, this is the share of the 10 snapshots in which the teacher was engaged in teaching activities. And for Teach, this was the share of the three snapshot observations in which the teacher is teaching or has provided a learning activity to most students.
The second variable, Share of Time Teaching and Learning, incorporates student learning and helps us understand the share of time that students are engaged in learning activities. Here again we calculated this variable differently for SDI, Stallings and Teach because these tools define “off-task” in different ways. For SDI, we constructed this variable by multiplying the “Share of Time Teaching” by the spot-check observations in which no more than six students were off-task. For Stallings, Share of Time Teaching and Learning was the share of the 10 snapshots in which the teacher was teaching and during which there was not a “large group” (i.e., six or more students) that was off-task. Similarly, for Teach, Share of Time Teaching and Learning was the share of the three snapshot observations in which the teacher is teaching with no more than five students off-task.
Box 2 reports our summary statistics on the time-on-task measures captured by each tool. As per the SDI tool, teachers spend 85 percent of their time in the classroom teaching, and 75 percent of the time teaching with most of the students on-task. The Stallings tool estimates these numbers to be lower at 73 and 61 percent respectively. The Teach-derived measure is similar to SDI for Share of Time Teaching (84 percent) and higher for Share of Time Teaching and Learning (81 percent). Box 2 indicates that the gap between Share of Time Teaching and Share of Time Teaching and Learning is narrow for Teach. This suggests Teach “penalizes” teachers less than SDI and Stallings for students being off-task.
| Mean | (SD) | 25th percen-tile | 75th percen-tile | ||
| SDI | |||||
| Share of Time Teaching | Share of minutes observed in which teacher is engaged in teaching activities. | 0.85 | (0.25) | 0.81 | 1.00 |
| Share of Time Teaching and Learning | Share of minutes observed in which teacher is engaged in teaching activities, adjusted by share of spot-check observations in which no more than 6 students are off-task. | 0.75 | (0.28) | 0.61 | 0.98 |
| Stallings | |||||
| Share of Time Teaching | Share of 10 snapshot observations in which teacher is engaged in teaching activity. | 0.73 | (0.25) | 0.60 | 0.93 |
| Share of Time Teaching and Learning | Share of 10 snapshot observations in which teacher is engaged in teaching activity and in which there are not 6 or more students who are off-task. | 0.61 | (0.29) | 0.41 | 0.87 |
| Teach | |||||
| Share of Time Teaching | Share of 3 snapshot observations in which teacher is engaged in teaching activities | 0.84 | (0.17) | 0.67 | 1.00 |
| Share of Time Teaching and Learning | Share of 3 snapshot observations in which teacher is teaching with no more than 5 students are off-task. | 0.81 | (0.21) | 0.67 | 1.00 |
To illustrate how these measures of Share of Time Teaching differ, Figure 1 plots the density distributions of the various indicators of Share of Time Teaching (Panel A), and Share of Time Teaching and Learning (Panel B). To isolate differences, the third panel (Panel C) plots the densities of the difference between the two, namely the time lost due to students being off task. These distributions, while consistent with the averages in Box 2 nevertheless provide additional insights. SDI, which records time in a minute-by-minute fashion, has the right-most distribution for Share of Time Teaching—meaning it assigns a greater share of time to be classified as teaching. In addition, the adjustment for learning based on the share of time with no more than 6 students off-task (which is recorded during snapshots at 5-minute intervals) has the left-most distribution. Stallings, where time on teaching is recorded during a snapshot every 10 minutes, has the left-most distribution for Share of Time Teaching—meaning that it assigns the least time as being classified as teaching. The distribution of time lost due to students being off-task is the right-most of the three tools—meaning that it is most likely to record an observation as being a non-learning one. Last, the Teach tool, which measures the time teaching in 3 snapshots during the first 15 minutes of a video clip, has an overall distribution of Share of Time Teaching time that is similar to that from Stallings. At the same time, however, the adjustment in Teach has a distribution that is somewhere between that of SDI and Stallings—with few high-values for share of time lost.
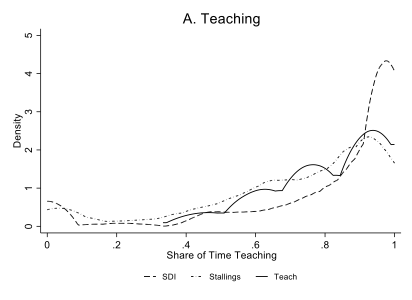
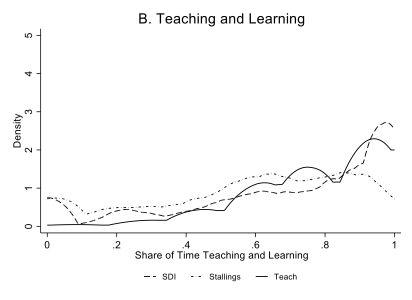
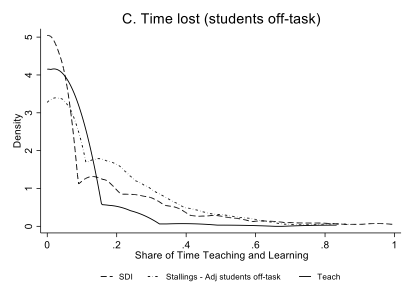
On net, Stallings and Teach have similar distributions in terms of Share of Time Teaching—and both are different from SDI. But patterns change after adjusting for off-task students. The adjustment has different effects for Stallings versus Teach, and the distributions are no longer similar. The result is that the distributions for SDI and Teach become similar after adjusting.
In this application, all three tools that capture “time-on-task” arrive at a similar understanding of Share of Time Teaching. Thus, for this specific measure, choice of tool appears to be inconsequential. However, the choice of tool becomes relevant when we adjust for learning. Individuals and institutions looking to implement classroom observation tools should carefully consider the definitions of teaching and learning in each tool prior to determining the tool that best suits their needs.
Next, we go from the time-on-task measure to the other measures captured by the tools. In Box 3 we provide details on the teacher behaviours and practices included in the different tools. These are measured as follows: After the lesson has been observed by an enumerator, the SDI tool is completed via a series of questions on teacher behaviours and practices that were observed during the lesson as well as questions on the physical conditions of the classroom and materials used in instruction; we group these into 5 aggregates: Good Teacher Demeanour, Good Pedagogical Practices, Classroom Environment, Materials and Infrastructure, and Use of Materials. In Stallings, enumerators similarly report on indicators from which we create 2 aggregates: Classroom Environment, and Materials and Infrastructure. The CLASS system involves trained raters observing a video clip and subsequently coding the totality of what they observed along 11 dimensions (these include, for example, “positive climate,” “behaviour management,” and “analysis and inquiry”). Scores are given on a 7-point scale ranging from low (=1) to high (=7). The scores on these 11 dimensions are then aggregated into 3 domains: Emotional Support, Classroom Organization, Instructional Support. For Teach, raters observe the same video clips and code the totality of this observation according to 9 “dimensions” (these include items such as “supportive learning environment,” “checks for understanding,” and “social and collaborative skills”). Each dimension is scored on a 5-point scale, ranging from low (=1) to high (=5). The 9 dimensions are aggregated into 3 areas: Classroom Culture, Instruction, and Socioemotional Skills.
The summary statistics suggest that SDI characterizes teachers as relatively high in terms of demeanour and average in terms of pedagogical practices (Box 3). SDI indicates a relatively high level of materials and infrastructure, whereas Stallings does not (this is likely driven by the fact that SDI captures that students have desks, and that the state of hygiene is reported as good)—suggesting that, even for an indicator related to classroom “hardware,” the choice of tool is not always inconsequential. The CLASS score is highest for Classroom Organization and lowest for Instructional Support. The Teach score is highest for Classroom Culture and lowest for support to Socioemotional Skills.
| Mean | (SD) | 25th percen-tile | 75th percen-tile | ||
|---|---|---|---|---|---|
| SDI | |||||
| Good Teacher Demeanour | Average of 7 0/1 variables capturing whether teachers: moved about the class; engaged with students; or projected a positive attitude. | 0.67 | (0.23) | 0.57 | 0.86 |
| Good Pedagogical Practices | Average of 13 0/1 items capturing whether teachers asked questions that stimulated thinking; provided constructive feedback to students; summarized the lesson; used homework as a tool; or uses local information from community to make learning relevant.13 | 0.56 | (0.18) | 0.49 | 0.69 |
| Classroom Environment | Average of 2 0/1 variables capturing whether pupil work and/or other materials are displayed on the walls. | 0.30 | (0.37) | 0.00 | 0.50 |
| Materials and Infrastructure | Average of 7 0/1 variables capturing whether students have textbooks, pens, exercise books, and/or desks; whether there are reading books in the classroom; whether the classroom has a blackboard that is readable and chalk; whether the classroom has electricity; the state of hygiene in the classroom; the state of hygiene in the classroom. | 0.68 | (0.11) | 0.57 | 0.71 |
| Use of Materials | Average of 3 0/1 variables capturing whether various materials were actually used during the lesson. | 0.76 | (0.26) | 0.67 | 1.00 |
| Stallings | |||||
| Classroom Environment | Average of 2 0/1 variables capturing whether pupil work or other materials are displayed on the walls. | 0.28 | (0.10) | 0.40 | 0.47 |
| Availability of materials and Classroom Infrastructure | Average of 5 0/1 variables capturing whether the classroom has a blackboard and chalk; whether there are reading books in the classroom; whether the classroom has electricity; whether students have textbooks/other printed material; or whether students have a notebook/writing material. | 0.43 | (0.35) | 0.00 | 0.50 |
| CLASS (7-point scales) | |||||
| Emotional Support | Scorer ratings for: Positive Climate; Teacher Sensitivity; Regard for Adolescent Perspectives. | 2.92 | (0.97) | 2.33 | 3.67 |
| Classroom Organization | Scorer ratings for: Negative Climate; Behaviour Management; Productivity. | 5.75 | (0.63) | 5.42 | 6.17 |
| Instructional Support | Scorer ratings for: Instructional Learning Formats; Content Understanding; Analysis and Inquiry; Quality of Feedback; Instructional Dialogue. | 2.66 | (0.95) | 2.00 | 3.20 |
| Overall CLASS | 3.78 | (0.73) | 3.27 | 4.24 | |
| Student Engagement | Captures the degree to which all students in the class are focused and participating in the learning activity presented or facilitated by the teacher. | 4.02 | (1.13) | 3.50 | 5.00 |
| Teach (5-point scales) | |||||
| Classroom Culture | Supportive Learning Environment; Positive Behavioural Expectations. | 3.65 | (0.31) | 3.50 | 4.00 |
| Instruction | Lesson Facilitation; Checks for Understanding; Feedback; Critical Thinking. | 2.43 | (0.38) | 2.25 | 2.75 |
| Socioemotional Skills | Autonomy; Perseverance; Social and Collaborative Skills. | 2.07 | (0.37) | 1.83 | 2.33 |
| Overall Teach | 2.46 | (0.24) | 2.30 | 2.64 | |
Finally, on the internal properties of these tools, our analysis shows that while all four classroom observation tools aspire to collect data on multiple dimensions of quality, the actual data in our sample has far fewer dimensions. Simply put, while the tools are designed to capture subtle differences in classroom practices, teacher behaviour, time use etc., the actual data captured by these tools in our sample Tanzanian schools do not reflect such differences.
We arrive at this through a Principal Component Analysis, the results of which are presented in Table 1.14 The left-hand columns of Table 1 report the summary statistics – namely the Eigenvalues, the difference in the Eigenvalues, and the proportion of the variance-covariance captured. The right-hand columns of Table 1 report the component loadings for the first three components for each set. When we apply the rule of thumb of retaining only components whose Eigenvalues is greater than 1, then we notice that none of the tools identify more than two “dimensions” of quality, and CLASS identifies only one.
| Summary Statistics | Component loadings for first three principal components | ||||||
| Eigen-value | Difference | Prop. | Comp1 | Comp2 | Comp3 | ||
|---|---|---|---|---|---|---|---|
| SDI (N=268) | |||||||
| Comp 1 | 2.86 | 1.65 | 0.48 | Share of time teaching and learning | 0.49 | 0.09 | -0.02 |
| Comp 2 | 1.21 | 0.40 | 0.20 | Good Teacher Demeanour | 0.52 | -0.02 | 0.04 |
| Comp 3 | 0.80 | 0.35 | .013 | Good pedagogical practise Materials and infrastructure Use of materials |
0.50 | -0.12 | -0.07 |
| Classroom environment | 0.06 | 0.70 | 0.70 | ||||
| Materials and infrastructure | 0.08 | 0.69 | -0.70 | ||||
| Use of materials | 0.48 | -0.15 | 0.08 | ||||
| Stallings (N=277) | |||||||
| Comp 1 | 1.32 | 0.31 | 0.44 | Share of time teaching and learning | 0.69 | -0.22 | 0.69 |
| Comp 2 | 1.00 | 0.32 | 0.33 | Materials and infrastructure | 0.71 | 0.02 | -0.71 |
| Comp 3 | 0.68 | . | 0.23 | Classroom environment | 0.14 | 0.98 | 0.17 |
| CLASS (N=148) | |||||||
| Comp 1 | 2.94 | 2.25 | 0.74 | Emotional support | 0.54 | -0.20 | 0.62 |
| Comp 2 | 0.69 | 0.49 | 0.17 | Classroom organisation | 0.39 | 0.89 | 0.12 |
| Comp 3 | 0.20 | 0.03 | 0.05 | Instructional support | 0.52 | -0.41 | 0.08 |
| Student engagement | 0.54 | -0.05 | -0.77 | ||||
| Teach (N=151) | |||||||
| Comp 1 | 1.48 | 0.46 | 0.37 | Share of time teaching and learning | 0.23 | 0.85 | 0.42 |
| Comp 2 | 1.02 | 0.17 | 0.26 | Classroom culture | 0.60 | -0.21 | 0.41 |
| Comp 3 | 0.85 | 0.20 | 0.21 | Instruction | 0.47 | 0.31 | -0.81 |
| Socioemotional skills | 0.60 | -0.36 | 0.06 | ||||
For SDI, there are two Eigenvalues greater than 1. Based on the component loadings, these could be described as “teacher behaviours” and “physical environment.” The former includes teacher demeanour, pedagogical practices, and use of materials. Stallings also identifies two dimensions, the first of which mostly relates to time use and materials & infrastructure. The second dimension relates to classroom environment. Teach also identifies two dimensions. The first is classroom practices which includes classroom culture, instructional support, and socioemotional skills. The second largely relates to time use with a smaller positive component loading on instruction. Finally, CLASS only identifies one dimension which aggregates the four different components with roughly equal weight.
In this section, we will review our main findings on how the various measures relate to one another across tools. Table 2 reports the full set of correlations across variables for each pair of tools. Note that these correlations are carried out on data that have been aggregated to the lesson level (i.e., the scores from two video clips from different parts of the same lesson have been combined) and averaged across multiple enumerators/raters when there are more of one of these for the same lesson or video clip. In each case the sample includes all observations in which the lesson has a score from the two tools in question, with the implication that the different correlations (e.g., SDI vs. CLASS and CLASS vs. Teach) are not always over the same sample.
Across the three tools that measure Share of Time Teaching, the correlation for this variable is highest for that between SDI and Stallings at 0.80 (Table 2 Panel A), 0.50 for the correlation between SDI and Teach (Table 2 Panel C), and as low as 0.43 for that between Stallings and Teach (Table 2 Panel E).15 The correlations for Share of Time Teaching and Learning are generally lower.
When we consider correlations between other measures, it is perhaps remarkable how low they are, even when sometimes statistically significant. Teaching and learning time from the various sources are generally positively associated with all four dimensions measured in CLASS. While the magnitudes of the correlation coefficients are not generally large (typically around 0.2 to almost 0.5), they are consistently statistically significant. The correlation coefficient is highest in the case of the “Classroom Organisation” variable in CLASS (where it reaches 0.55 for the correlation with Share of Time Teaching from SDI, Table 2 Panel B). Share of Time Teaching and Share of Time Teaching and Learning are modestly (albeit statistically significantly) correlated with the Instruction variable from Teach (Table 2 Panels C and E).
The correlations between the high-inference variables in CLASS and Teach do not suggest a close mapping between any of these (Table 2 Panel F). The variables are all positively correlated with one another (with coefficients that are statistically significant), but small. Correlations are even low for indicators that are conceptually related: the correlation between Instructional Support from CLASS and Instruction from Teach is 0.31 (this is the highest correlation observed). Aggregating appears to increase the correlations: for example, the aggregate measures derived from these two tools are correlated with an overall correlation coefficient of 0.36.
These findings suggests that, in this application, our understanding of teaching and classroom practices is tool dependent. Since there is no gold-standard for effective teaching and classroom management, these results indicate that it is important to assess the specific elements of each tool before deciding which one to implement in any given context and for which purpose.
| Stallings | |||||
| Share of time teaching | Share of time teaching and learning | Materials and infrastructure | Classroom environment | ||
|---|---|---|---|---|---|
| SDI | Share of time teaching | 0.80 | 0.66 | 0.29 | 0.00 |
| Share of time teaching and learning | 0.66 | 0.70 | 0.25 | 0.04 | |
| Good teacher demeanour | 0.36 | 0.31 | 0.22 | 0.07 | |
| Good pedagogical practise | 0.33 | 0.25 | 0.19 | -0.03 | |
| Classroom environment | 0.06 | 0.06 | -0.02 | 0.69 | |
| Materials and infrastructure | 0.20 | 0.24 | 0.21 | 0.00 | |
| Use of materials | 0.39 | 0.27 | 0.21 | 0.00 | |
| CLASS | ||||||
| Emotional support | Classroom organisation | Instructional support | Overall CLASS | Student engagement | ||
|---|---|---|---|---|---|---|
| SDI | Share of time teaching | 0.23 | 0.55 | 0.24 | 0.37 | 0.31 |
| Share of time teaching and learning | 0.19 | 0.47 | 0.26 | 0.34 | 0.29 | |
| Good teacher demeanour | 0.20 | 0.24 | 0.20 | 0.24 | 0.19 | |
| Good pedagogical practise | 0.18 | 0.23 | 0.20 | 0.24 | 0.28 | |
| Classroom environment | 0.05 | 0.02 | 0.02 | 0.03 | 0.01 | |
| Materials and infrastructure | -0.04 | 0.17 | -0.03 | 0.02 | -0.05 | |
| Use of materials | 0.16 | 0.19 | 0.14 | 0.18 | 0.15 | |
| Teach | |||||||
| Share of time teaching | Share of time teaching and learning | Classroom culture | Instruction | Socio-emotional skills | Overall Teach | ||
|---|---|---|---|---|---|---|---|
| SDI | Share of time teaching | 0.50 | 0.39 | -0.02 | 0.19 | 0.00 | 0.09 |
| Share of time teaching and learning | 0.33 | 0.32 | 0.04 | 0.14 | -0.02 | 0.07 | |
| Good teacher demeanour | 0.09 | 0.11 | 0.09 | 0.14 | 0.10 | 0.15 | |
| Good pedagogical practise | 0.07 | 0.08 | 0.12 | 0.18 | 0.08 | 0.21 | |
| Classroom environment | -0.08 | -0.05 | 0.02 | 0.01 | 0.06 | 0.04 | |
| Materials and infrastructure | 0.03 | 0.00 | 0.07 | 0.12 | -0.10 | 0.05 | |
| Use of materials | 0.09 | 0.09 | 0.06 | 0.30 | 0.23 | 0.29 | |
| CLASS | ||||||
| Emotional support | Classroom organisation | Instructional support | Overall Class | Student | ||
|---|---|---|---|---|---|---|
| Stallings | Share of time teaching | 0.22 | 0.43 | 0.19 | 0.30 | 0.18 |
| Share of time teaching and learning | 0.30 | 0.42 | 0.28 | 0.37 | 0.23 | |
| Materials and infrastructure | 0.14 | 0.27 | 0.13 | 0.20 | 0.15 | |
| Classroom environment | 0.13 | 0.12 | 0.09 | 0.13 | 0.11 | |
| Teach | |||||||
| Share of time teaching | Share of time teaching and learning | Classroom culture | Instruction | Socio-emotional skills | Overall Teach | ||
|---|---|---|---|---|---|---|---|
| Stallings | Share of time teaching | 0.43 | 0.33 | -0.15 | 0.21 | -0.17 | -0.02 |
| Share of time teaching and learning | 0.41 | 0.41 | 0.00 | 0.22 | -0.10 | 0.06 | |
| Materials and infrastructure | 0.19 | 0.22 | 0.26 | 0.05 | 0.04 | 0.14 | |
| Classroom environment | -0.04 | 0.00 | 0.00 | 0.04 | 0.12 | 0.07 | |
| Teach | |||||||
| Share of time teaching | Share of time teaching and learning | Classroom culture | Instruction | Socio-emotional skills | Overall Teach | ||
|---|---|---|---|---|---|---|---|
| CLASS | Emotional support | 0.26 | 0.25 | 0.18 | 0.25 | 0.20 | 0.32 |
| Classroom organisation | 0.32 | 0.24 | 0.14 | 0.16 | 0.07 | 0.17 | |
| Instructional support | 0.24 | 0.24 | 0.14 | 0.31 | 0.23 | 0.37 | |
| Overall CLASS | 0.31 | 0.29 | 0.18 | 0.30 | 0.21 | 0.36 | |
| Student engagement | 0.31 | 0.25 | 0.17 | 0.30 | 0.23 | 0.37 | |
Note: Correlation coefficients above 0.3 are in bold; correlation coefficients above 0.15 are generally statistically significantly different from 0 (at the 5 percent level).
In addition to the classroom observations, students of the Grade 4 teachers who were observed also sat for mathematics, Kiswahili, and English tests twice in four months.16 The models regress the normalised (mean 0, standard deviation 1) student test score against the full set of variables that emerge from the observation tools—i.e., a “kitchen sink” approach. We include two variables related to the share of time spent in teaching and learning from SDI: the Share of Time Teaching and a separate variable equal to the share of time lost due to students being off-task. In addition, we include a test score for the teachers’ subject content knowledge. A fully specified model also includes a set of student, household, teacher, and school characteristics.17
Because there is heterogeneity across teachers, we separate the sample into teachers who score below and above 0 on the (normalised) teacher test (we refer to this below as the “threshold”).18 The coefficient estimates on the teacher observation and teacher score variables from all of these regressions are reported in Table 3. The tables also report p-values for F-tests of whether the coefficients on the variables in each of the sets of control variables are jointly equal to zero.
It is important to recognise that we cannot provide a causal interpretation to these estimates. While controlling for student, family, teacher, and school characteristics might help to identify the link from teacher skills and behaviours to student test scores, there are a variety of potential selection and reverse causation channels that we cannot rule out. The findings are therefore only indicative of (conditional) associations in the data.
Teacher variables for the observations systems (along with the test score) capture a limited—but not insignificant—share of the overall cross-sectional variation in student test scores, as measured by the R-square (Table 3). For teachers who score below the threshold of 0 on the teacher test the share is on the order of 19 percent; for teachers above the threshold, it is about 15 percent. Adding in the control (student, teacher, school) variables boosts the overall share of variation explained by about an additional 20 percentage points.
The main finding to emerge from these regression models is the difference in patterns across teachers who scored above and below the threshold on the teacher test. For teachers above the threshold, good teaching practices are associated with better student test scores. For teachers below the threshold, it is the teacher test scores themselves that have a large, positive, and statistically significantly positive association with student test scores. The association with Share of Time Teaching is also large and positive with student scores for teachers below the threshold (and is more muted for teachers above the threshold). In addition, for teachers below the threshold, Student Engagement from CLASS and support to Socioemotional Skills from Teach are significantly associated with student test scores.
| Teachers with test score <=0 | Teachers with test score >0 | |||
| (5) | (6) | (9) | (10) | |
|---|---|---|---|---|
| Share of time teaching (SDI) | 1.76*** (0.55) |
2.06*** (0.74) |
0.56* (0.32) |
0.54** (0.25) |
| Share of time lost (SDI) | -0.88** (0.35) |
-0.31 (0.68) |
-0.68 (0.58) |
-0.27 (0.63) |
| Good teacher demeanour (SDI) | 0.24 (0.55) |
0.96 (0.62) |
-0.26 (0.49) |
-0.97** (0.40) |
| Good pedagogical practice (SDI) | -0.57** (0.62) |
-0.60*** (0.38) |
-0.22 (0.76) |
-0.48 (0.41) |
| Classroom environment (SDI) | -0.08 (0.18) |
-0.15 (0.12) |
-0.65** (0.24) |
-0.35** (0.15) |
| Availability of materials (SDI) | 1.43 (0.97) |
0.17 (0.62) |
2.05* (1.02) |
2.10** (0.81) |
| Use of materials (SDI) | -0.44 (0.31) |
-0.11 (0.38) |
-0.31 (0.36) |
0.33 (0.29) |
| Emotional support (CLASS) | -0.23 (0.24) |
0.21 (0.24) |
0.23 (0.22) |
0.10 (0.16) |
| Classroom organisation (CLASS) | 0.09 (0.20 |
-0.35* (0.20) |
-0.23* (0.13) |
0.05 (0.16) |
| Instructional support (CLASS) | 0.42* (0.22) |
-0.50** (0.24) |
0.00 (0.24) |
-0.03 (0.14) |
| Student engagement (CLASS) | -0.15 (0.18) |
0.60*** (0.16) |
0.03 (0.13) |
-0.04 (0.09) |
| Classroom culture (Teach) | 0.39 | -0.76*** (0.25) |
0.44* (0.23) |
0.45*** (0.16) |
| Socioemotional skills (Teach) | 0.86*** (0.29) |
1.18*** (0.26) |
0.38*** (0.18) |
0.03 (0.16) |
| Teacher test score | 0.15 (0.09) |
0.20*** (0.06) |
0.21 (0.25) |
-0.32 (0.25) |
|
|
||||
| Observations | 2,333 | 2,300 | 2,286 | 2,286 |
| R-squared | 0.19 | 0.37 | 0.15 | 0.34 |
| Controls | NO | YES | NO | YES |
| F-Test: Observation variables | 0.00 | 0.00 | 0.00 | 0.00 |
| F-Test: Student variables | 0.00 | 0.00 | ||
| F-Test: Household variables | 0.00 | 0.00 | ||
| F-Test: Teacher variables | 0.00 | 0.01 | ||
| F-Test: School variables | 0.00 | 0.00 | ||
In this study, we compared four different classroom observation tools—SDI, Stallings, CLASS, and Teach—in a sample of about 100 schools in Tanzania. There are three main findings in this application we focus on here.
First, while all the tools aim to collect a number of “dimensions” of quality—the resulting data collected for each tool have far fewer dimensions.
Second, measures associated with time-on-task tend to be correlated across tools. However, we do not find that the other variables from the various tools are highly correlated with each other, even when they would appear to be conceptually related. This suggests more cautious use of classroom observation tools in determining teacher and school accountability policies. Use of such tools may be most useful in “low-stakes” contexts where they can encourage reflection, strengthen feedback loops, and contribute to improved instruction.
Third, the tools produce measures that are associated with student test scores, suggesting that they capture aspects of teacher quality that may matter for student learning outcomes. In particular, the results suggest that teacher subject knowledge may act as a binding constraint to student learning for teachers with low knowledge—and improving that knowledge should be a policy priority. At the same time, instructional behaviours matter for teachers with greater subject knowledge—suggesting that this is a margin to work on for these teachers. At the same time, more research is needed to establish the causal nature of these associations.
Understanding which teacher behaviours and practices most closely map to better student learning outcomes, and how to measure those behaviours and practices, are important steps to designing better policies and programs for recruiting and training teachers. More experience with the various tools described here, including across a variety of contexts, will be a key part of that process. If implemented in a way that results can be directly compared across tools, this experience will shed further light on how to overcome the measurement challenges involved.19
Azigwe, J. B., Kyriakides, L., Panayiotou, A. and Creemers, B.P.M. 2016. The Impact of Effective Teaching Characteristics in Promoting Student Achievement in Ghana. International Journal of Educational Development. Vol. 51: 51-61.
Bruns, B., DeGregario, S. and Taut, S. 2016. Measures of Effective Teaching in Developing Countries. RISE Working Paper Series. https://doi.org/10.35489/BSG-RISE-WP_2016/009
Coflan, A.M., Ragatz, A., Hasan, A. and Pan, Y. 2018. Understanding Effective Teaching Practices in Chinese Classrooms: Evidence from a Pilot Study of Primary and Junior Secondary Schools in Guangdong, China. World Bank Policy Research Working Paper No. 8396. Washington, DC.
Hamre, B.K., Pianta, R.C., Mashburn, A.J. and Downer, J.T. 2007. Building a Science of Classrooms: Application of the CLASS Framework in Over 4,000 US Early Childhood and Elementary Classrooms. Foundation for Childhood Development.
Kane, T.J. and Staiger, D.O. 2012. Gathering Feedback for Teaching: Combining High-Quality Observations with Student Surveys and Achievement Gains. Bill & Melinda Gates Foundation.
Martin, G. and Wane, W. 2016. Education Service Delivery in Tanzania. World Bank Report No. AUS5510. https:// microdata.worldbank.org/index.php/catalog/2748/download/39242
Molina, E., Fatima, S.F., Ho, A., Melo Hurtado, C., Wilichowksi, T. and Pushparatnam, A. 2018. Measuring Teaching Practices at Scale: Results from the Development and Validation of the Teach Classroom Observation Tool. World Bank Policy Research Working Paper No. 8653. Washington, D.C. https://openknowledge.worldbank.org/handle/10986/30880
Molina, E., Melo Hurtado, C., Pushparatnam, A. and Wilichowski, T. 2019. Teach: Observer Manual. Washington, D.C.: World Bank. https://documents1.worldbank.org/curated/en/949541542659103528/pdf/Teach-Observer-Manual-First- Edition.pdf
Pianta, R.C., Hamre, B.K. and Susan Mintz. 2012. Classroom Assessment Scoring System: Upper Elementary Manual. Teachstone.
Stallings, J.A. 1976. How instructional processes relate to child outcomes in a national study of follow through. Journal of Teacher Education. Vol. 27(1): 43-47.
Stallings, J.A., Knight, S.L. and Markham, D. 2014. Using the Stallings Observation System to investigate time on task in four countries. World Bank Report No. 92558. http://documents.worldbank.org/curated/en/496851468182672630/ Using-the-stallings-observation-system-to-investigate-time-on-task-in-four-countries
World Bank. 2015. Conducting Classroom Observations: Analyzing Classrooms Dynamics and Instructional Time. Washington, DC. https://openknowledge.worldbank.org/handle/10986/22401
We thank Diwakar Kishore and Tracy Marie Wilichowski for excellent research assistance in this project. Funding support from the World Bank and in particular the Knowledge for Change Program (KCP) Trust Fund, as well as from the Research on Improving Systems of Education (RISE) Programme are gratefully acknowledged. We also acknowledge the Tanzanian students, teachers, schools, and government officials who contributed to this research, as well as the staff at REPOA who collected the survey data. All authors are World Bank staff. Corresponding author: dfilmer@ worldbank.org. The findings, interpretations, and conclusions expressed in this paper are entirely those of the authors. They do not necessarily represent the views of the World Bank and its affiliated organisations, or those of the Executive Directors of the World Bank or the governments they represent.
Filmer, D., Molina, E. and Wane, W. 2022. Identifying Effective Teachers: Highlights from Four Classroom Observation Tools. RISE Insight Series. 2022/038. https://doi.org/10.35489/BSG-RISE-RI_2022/038