Luis Crouch
RTI International (Emeritus)
Blog

The International Commission on Financing Global Education Opportunity (“The Commission”) has issued a bold proposal: “To galvanize attention globally, a single global indicator of learning should be agreed on to complement national measures of learning. The international community should track, rank, and publicize countries’ progress in getting all children learning.” This proposal itself has already “galvanized attention.” The Commission’s proposal is predicated on the idea that this “galvanizing of attention” will be useful in defending funding and, by focusing policy and managerial attention within countries, it will spur action and achievement, which in turn helps defend funding, creating a virtuous cycle that can speed up achievement of the education Sustainable Development Goal (SDG).
Technical actors have also called for learning indicators. A good example was the call by Deon Filmer, Amer Hasan, and Lant Pritchett (RISE Research Director) for a “millennium learning goal,” issued now some ten years ago via a working paper for the Center for Global Development, a partner in the RISE Programme.
Concerns have arisen, however. There are probably two that are most important. First, the possibility that a “focusing” or “galvanizing” of attention might also mean a “narrowing” of attention. If the indicator focuses on primary education (as it seems reasonable to suppose), then the other “sub-sectors” could receive less attention. If the indicator focuses on a couple of subjects, then the danger is “curricular narrowing.” Second, a concern that focusing on measurement, rather than spurring substantive action to move the indicator, could spur more interest in measurement per se, as well as more neurotic, somewhat desperate, but ineffective attempts to improve on the indicator—these attempts could take up a lot of time and energy and lead to little movement on the indicator. The folksy saying is that “one cannot fatten cattle by weighing it”—with the implication that a neurotic fixation on weighing (measuring learning) detracts from the task of fattening (teaching). The Millenium Development Goal (MDG) in education, on the contrary, one could argue, required actions that countries already more or less knew how to undertake: build more schools, reduce fees, and train and certify more teachers.
It is impossible to argue with certainty that either the positive or negative outcomes envisioned by proponents and critics will or will not come to pass. Nor is it likely that the results of having indicators as bold and “tight” as the one proposed by The Commission, will be an unalloyed utopia or an unalloyed dystopia. To some degree, a little of both may come to pass. So, the real question is whether having such indicators might do more good than harm. And in judging this, turning to other sectors that seem to have made good use of indicators and targets makes sense, allowing for a comparison of the experience to that of the education sector.
The Commission itself suggested comparison with the health sector’s utilization of the under-five mortality (UFM) rate as an indicator that galvanized attention. The UFM rate is a measure of the number of children who die in the age range 0 to 5, out of 1,000 live births, and was chosen as the indicator for the goal of reducing child mortality (as an anchor point: values in high-income countries are around 8). It makes sense to look at what happened here, and to compare the use of this indicator to the primary school completion rate (PSC), arguably the most commonly-used education indicator for the MDG regime (as an anchor point: values in high-income countries are around 98%).* The comparison may be useful in establishing the convenience of an indicator such as that which The Commission proposes.
One factor that is immediately apparent is that in child mortality, the goal, the indicator, and the target all aligned very closely in terminology. The goal was about reducing child mortality, the target was to reduce this mortality by two thirds, and the indicator was the UFM. In education, the goal, target, and indicators were not as closely aligned, terminologically and conceptually. The goal talked about “Achieving Universal Primary Education,” the target related to completion, and the indicators included only a loose variant of completion.
More importantly, the UFM target was ambitious yet, apparently, fairly doable. Figure 1 shows the progress in PSC and UFM in low- and middle-income countries since 1990. It also shows two comparison points to gauge both ambition and progress: dots (with colors matching that of the lines) for the level of these indicators for high-income countries in 1990, as well as squares for the 2015 target. A few things immediately stand out.
Figure 1
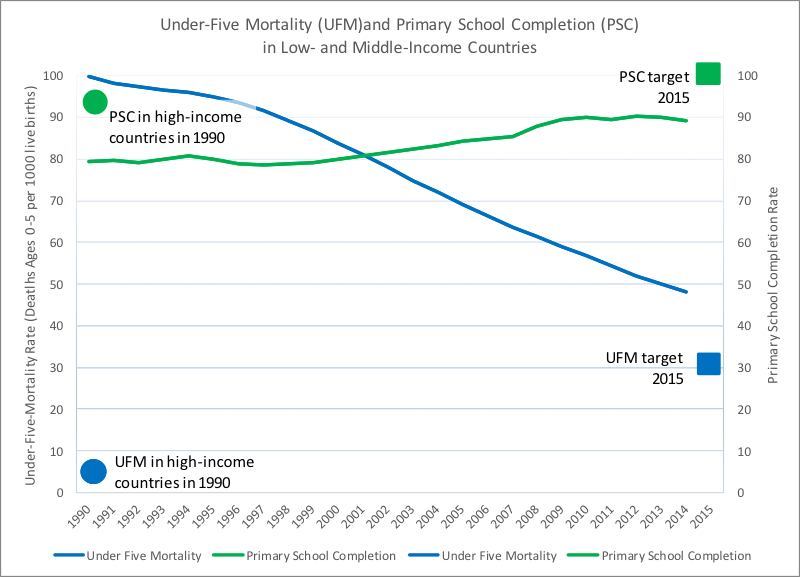
Source: World Bank online development indicators, at databank.worldbank.org/data/download/WDI_excel.zip.
First, the education target was not very ambitious, as low- and middle-income countries were, even in 1990, not very far behind the high-income countries, and not very far behind the goal (compare the beginning of the blue line to the blue square in 2015). In comparison, the UFM in high income countries was much lower than in the low- and middle-income countries, so the goal was more demanding relative to where the low- and middle-income countries were, either in 1990 or in 2010 (compare the green square in 2015 to the beginning of the green line).
Second, UFM improved much faster. This can be seen from the comparative steepness (down) of the blue UFM line versus the steepness (up) of the green PSC line. In case the slopes of the lines are misleading due to differences in the units of measurement, one can judge not just by the slope, but also in terms of the percentage rates of change: - 4 percent per year on average for UFM, versus 1 percent per year on average for PSC. In addition, and importantly, the PSC came closer to its goal (it missed by only 10 percent and 10 percentage points) than UFM (missed by 40 percent).
In retrospect, one imagines what might have gone through a funder’s mind around 2013, and might still be going through funders’ minds: “I can invest in one sector that sets ambitious targets, that is making much faster progress, and yet is likely to miss its target by a good bit unless we accelerate progress even more, or I can invest in another sector that is making slower progress but is nonetheless likely to come close to meeting its target.” The answer seems obvious, in retrospect, and explains the sense among funders and policy-makers, as one approached 2015, that “there is less to do in education than in health.”
One additional point is that the UFM goal is, much more so than the PSC goal, in some sense, self-targeting towards the most vulnerable. The fact that that even in 1990, the gap for UFM between the poor and the rich of the world was much bigger (high income countries had rates 1/10th of the lower- and middle-income countries) than for the completion rate (low- and middle-income countries had rates that were 9/10ths of those in high income countries), meant that a focus on UFM could be more readily assumed to self-target towards the more vulnerable.
Is there evidence that the health sector’s singular focus on UFM (and maternal mortality) skewed priorities? To some degree, but only to some degree. But, was this not the whole purpose? In terms of the facts: it is clear that, for instance, adult male mortality (not an MDG) in low- and middle-income countries improved over the past 15 years at only 1.3 percent per year on average, whereas UFM improved at 4 percent. But there are three important points that can be made in this regard. First, adult male mortality did not cease to improve (despite the HIV/AIDS epidemic and the advance of chronic diseases that, as incomes increase, affect mostly adults). Second, arguably, under-five children were more vulnerable than adult males to start with, since the UFM rate for high-income countries was an astounding 1/10th that of low- and middle-income countries, while the adult male mortality was “only” 7/10ths. Clearly, young children were much more vulnerable, and it makes moral sense to start where the greatest vulnerability is. Finally, it also makes practical, not just moral sense in some cases, to start where the greater vulnerability is. With focused attention, it was possible to make faster progress with UFM. The necessary package of interventions was known; one “simply” had to gather the political will (a task with which the clarity and ambition of the indicators helped), and set priorities to use the knowledge that existed. One last point in this regard is that part of the reason why increased focus on one issue (e.g., UFM or maternal mortality) might not reduce focus on other issues (e.g., adult male mortality) as much as one might fear is that managerial lessons learned from one sub-sector can spill over into other sub-sectors: the “management by objectives” lessons used in vaccination drives (measure, intervene, track and report, re-design, etc.) could, plausibly, be used in controlling afflictions that affect the general population.
Does the argument around relative vulnerability apply to The Commission’s presumed indicator (assuming it applies to primary education, as it likely ought to)? Might such a focus detract from attention to, say, secondary gross enrollment (or some other goal)? If so, is there greater vulnerability in secondary gross enrollment or in learning outcomes at the primary level? The data seems clear. Low- and middle-income countries gross enrollment ratios at the secondary level are already at 70 percent of what they are in the high-income countries. It is hard to make such a simple comparison with respect to learning outcomes because the truly low-income countries do not participate in comparative learning assessments nearly in the same proportion as the high-income countries. However, using the Grade 4 Trends in International Mathematics and Science Study (TIMSS) 2015 results, we know the poorest countries in that assessment, which are, by a very long shot, not the poorest in the world, have only around 20 percent of their primary school students at “intermediate,” “high,” or “advanced” levels, whereas the top 30 or so countries have 80 percent of their children at those levels. According to my relatively casual extrapolations from a paper by Justin Sandefur at the Center for Global Development, we would estimate that the 20 percent just noted, would be at best 15 percent (but perhaps closer to 10 percent) if one included more of the poorest countries. The cognitive gap between 15 percent at intermediate, high, or advanced levels in low-income countries, and 80 percent in high income countries, in primary school mathematics, is thus, a far bigger gap than the gap in access to secondary school—by several multiples. Alternatively, in the paper by Filmer, Hasan, and Pritchett noted above, we know the median child in the poorer countries (not even the poorest) would place at about the 5th percentile of the learning distribution in the Organisation for Economic Co-operation and Development (OECD) countries. Thus, the largest vulnerability is manifested in the learning gap between the poorest countries and the richest ones, rather than in how many of their students access secondary school.
Did the clarity of goals, and the ability to show fast progress (as well as the gap between that fast progress and what remains to be done) motivate funding? It is impossible to develop a causal answer to this question. However, the trends in official development assistance (ODA) are highly suggestive. Figure 2 charts ODA flows to both basic education and basic health.
Figure 2
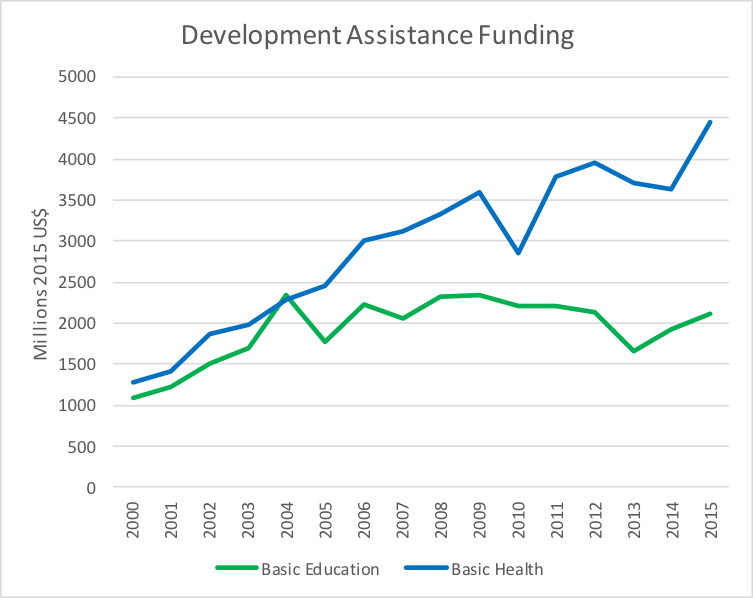
Source: OECD-DAC database, Dataset: Aid (ODA) by sector and donor [DAC5], at http:s//stats.oecd.org/Index.aspx?datasetcode=TABLE5.
The difference is clear. From approximately equal funding in the early 2000s, funding for basic health is, today, more than double the funding for basic education. If one were to add funding for reproductive health (including funding for HIV/AIDS issues) and sectors that are not part of the MDGs, but which have had intensive use of data and in which progress documentation has been very data-intensive, the picture is even more skewed. Of course, those sub-sectors have also had much more focused and intense advocacy, not just data and goal-clarity.
Trends in public expenditure by the low- and middle-income countries on the two sectors (which may include pass-throughs of development assistance), as a percentage of GDP, reveals the same thing: the average yearly increase in education spending, as a percentage of GDP, has been 0.003 per year, for health it has been .03 per year: 10 times higher for health.
Though not yet operationalized, the indicator proposed by The Commission could be as “clever” as the UFM indicator was. For many reasons, including technical, practical, and policy-driven, it is safe to assume that an indicator of learning should be based on whole cohorts of populations, rather than simply those in school. We know that some countries find it relatively easy to increase the learning outcomes of those in school, if there are not many children in school, and this should not be incentivized.
It could be set to create a stretch target, though not an unreasonable one. If it focuses on learning, and it operationalizes that focus properly (e.g., increasing the percentages of children above the least-proficient categories in learning assessments), it could create a galvanizing and relatively self-targeting focus on the most vulnerable. If tied to evidence that countries transition from low learning average levels to middle average learning levels by helping the most vulnerable within their own societies, the indicator could provide powerful incentives to improving the cognition of the most vulnerable. In addition, as was the case with UFM in the late 1990s, there is increasingly clear evidence about how to make progress with the cognitive development of the most vulnerable. The proposed indicator has enormous potential, but a lot depends on how it is operationalized.
In that context, it may be wise to state that while a global indicator, by definition, may need to be “one” global indicator, it may not require a single source of measurement or metric, such as a single assessment. And, in fact, a single assessment may not be reasonably possible for technical reasons. This, however, is a matter for another discussion.
In summary, a good argument can be made that goal-setting in the health sector has served the health sector better than goal-setting in the education sector has served the education sector: the goals tended to be “stretch” goals, but not wildly so; the goals were in areas where, arguably, reasonably speedy progress was known to be possible because the “technology” was increasingly clear and one was starting from a low base; and the goals tended to be self-targeting towards the most vulnerable, or at least a plausible argument could be made that they were so. It may be that the goals did skew priorities a bit, but not a lot, and in any case, maybe priorities did need to be skewed to areas were the low- and middle-income countries were relatively farther from the high-income countries, and to areas that were self-targeting to the most vulnerable.
* One could argue about which education indicator was most used for the goal of “Achieving Universal Primary Education.” At the global level, the international community paid a lot of attention to the absolute number of children out of school. However, development agencies and countries themselves, in setting out plans and budgets, typically paid more attention to the primary school completion rate. We would argue that this indicator is the one most closely aligned with the target: to “Ensure that, by 2015, children everywhere, boys and girls alike, will be able to complete a full course of primary schooling.”
RISE blog posts and podcasts reflect the views of the authors and do not necessarily represent the views of the organisation or our funders.