Lant Pritchett
Blavatnik School of Government, University of Oxford
Blog
An exciting new paper prompts important questions about the root causes of long-term literacy trends—and how those root causes can inform the actions we take in future.

I have been privileged to be the Research Director of RISE and see the project produce dozens and dozens of important papers on basic education in developing countries in many different countries, from many different disciplines, using many different methods.
But I don’t want to ignore important research that emerges elsewhere. Alexis Le Nestour, Laura Moscoviz, and Justin Sandefur from the Center for Global Development (which was an important early partner in RISE) have recently produced an empirical paper that poses profound and pressing questions.
In their paper (which is available as a consultation draft here) they use the assessing of reading from the Demographic and Health Surveys (DHS) and the Multiple Indicator Cluster Survey (MICS) to estimate long term trends in ability to read of those who attended school.
The DHS (and now supplemented by the MICS) are a uniquely rich resource because they have carried out the same survey instrument in many countries and in multiple waves. In the more recent waves they surveyed women (and also men in some instances, but I am going to focus on the results for women) who had not attended secondary school. These women were asked to read a simple, few word, sentence like “Farming is hard work” or “Children should study hard” in any language of their choosing (as enumerators had these sentences in the variety of relevant languages). If women could read the sentence without help, they were classified as able to read—so this is a very low bar and not a test of functional literacy or ability to read sophisticated texts for content, just could they decode text into words.
The genius of this new paper is realizing that with multiple waves over time of large cross-sections of women at different ages with data on school attendance and ability to read we can now estimate the likelihood a woman born in a certain year (say, 1972) and hence likely to have started and attended school in particular year and who completed a given grade level (say, Grade 5) could read:
ProbabilityBirth Year=T(Read|Completed exactly Grade 5), or Read@G5 for short.
The data can also estimate how many women achieved Grade 5 or higher and so can estimate both the expansion of schooling and the evolution of reading ability in women who attended school up to Grade 5.
Figure 1 is a figure I have made from the data in their Appendix A.4, Table 7 which shows the change over time in the share of women completing Grade 5 or higher and the change in the proportion who could Read@G5. Every country has a different span of time over which these can be estimated due to the timing and frequency of the surveys and so I normalise the annual rates of change to a 30-year period (most countries span 30 to 40 years, from both cohorts in the 1950s to 1990s).
The horizontal axis of Figure 1 shows the truly impressive expansion in women’s schooling. The typical country saw women’s completion of Grade 5 or higher increase by 20.6 percentage points over a 30-year period.
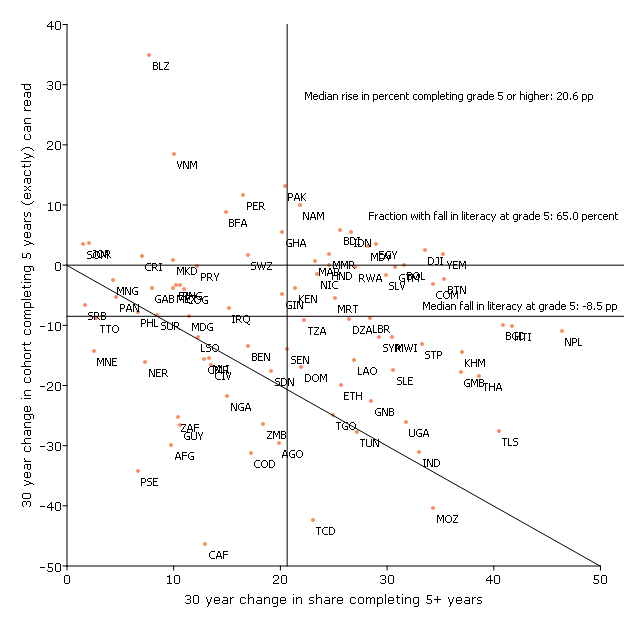
Source: Author’s figure based on Le Nestour, Moscoviz, and Sandefur 2021, A.4 Table 7.
The vertical axis though shows the opposite was true for Read@G5. In the typical country, that fell by 8.5 percentage points. In some countries, like Vietnam and Peru, there were impressive increases. But in most countries this reading measure fell, and in some the fall was quite large. Countries below the diagonal line experience a fall in Read@G5 by more than women with Grade 5 or above attainment rose. In these countries, like Zambia, the literacy rate rose much more slowly that Grade 5 and above completion rose because Read@G5 fell so much.
Figure 2a shows the levels of the two variables for the first birth cohort (yellow) and last birth cohort (blue) and arrows connecting those two for selected countries.
Some nations improved women’s completion of Grade 5 while also endowing those women with more literacy than before:
But many countries had a pattern of similarly sized expansions in schooling but with large to massive declines in the proportion of Grade 5-completing women who could read:
A very interesting comparison is Ghana and Zambia. As noted in previous research (Pritchett and Sandefur 2015, Kaffenberger and Pritchett 2021), in the most recent data Ghana has one of the lowest proportion of Grade 5-completing women who can read of any country in the world, with only 13.2 percent of women with Grade 5 exactly complete able to read (a finding which is robust across three different DHS waves). However, that appears to be because Ghana is slowly improving this statistic from a very, very low base.
In contrast, in the 1998 birth cohort in Zambia the proportion of Grade 5-completing women who could read was only 22.6 percent, also one of the lowest in the world. However, Zambia did not get there from slow improvement from a low base. Rather, in the birth cohort of 1954 this proportion was 61.2 percent and there has been a 1.1 pppa fall from 1954 to 1998.
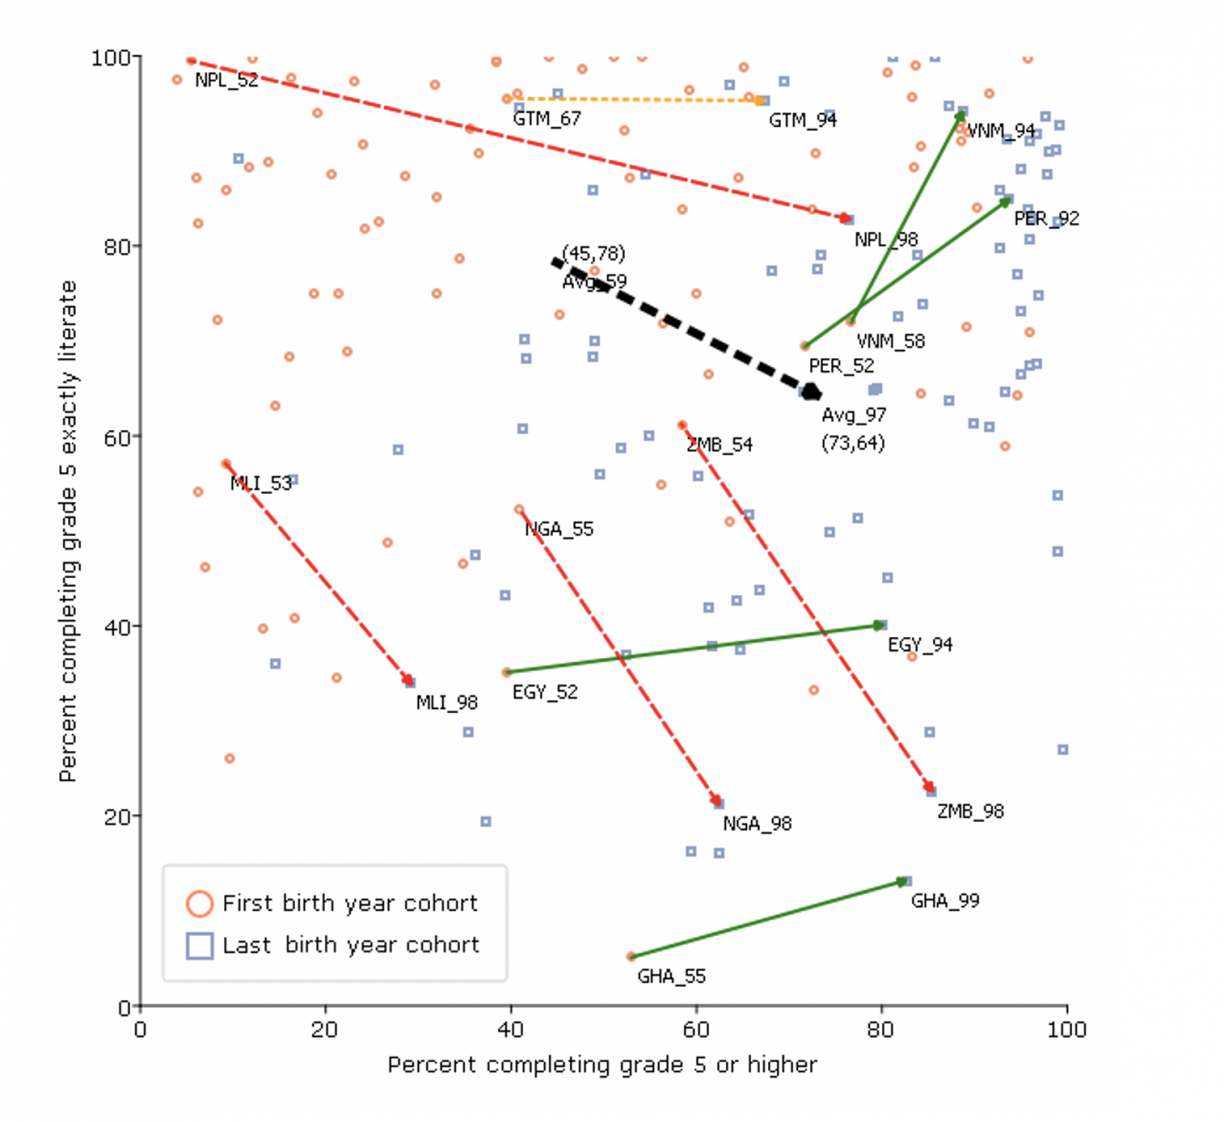
Source: Author’s figure based on Le Nestour, Mosocviz, and Sandefur 2021, A.4 Table 7. Green: Read@G5 rising. Yellow: Read@G5 falling but total fall less than average. Red: Read@G5 total fall more than average.
Figure 2b shows the same graph but for different countries, which again demonstrate the array of experiences in the joint evolution of schooling and reading Read@G5.
From those born in 1954 to 1997 Indonesia saw a massive expansion in schooling: those with Grade 5 or higher increased from 58.5 to near universal, 96.6. And, over the same period the proportion of Grade 5-completing women who could read rose from 83.9 percent to 91.7 percent (and so estimated “literacy” of the 1997 cohort was 97.7 percent).
Between the birth cohorts of 1958 and 1999, Bangladesh saw a true revolution in girls’ education as the fraction completing Grade 5 or higher rose from only 28.5 percent to 84.3 percent. During that period there was only a modest fall in Read@G5, from 87.3 to 73.8 percent, retaining quite high levels.
In some countries, like Ethiopia (or Mozambique) the expansion of schooling was just beginning for the birth cohort of 1952. Only 4 percent of women in that cohort attended Grade 5 or higher and, perhaps not surprisingly, 97.5 percent of these highly selected and privileged women could read. As schooling expanded massively for the birth cohort of 1996 to include 41.6 percent of women, the Read@G5 fell to 68.2 percent.
And other countries, like the Sahelian country Niger remain (for the 1992 birth cohort) at very low levels of both schooling (14.6 percent) and reading ability for Grade 5-completing women (36 percent).
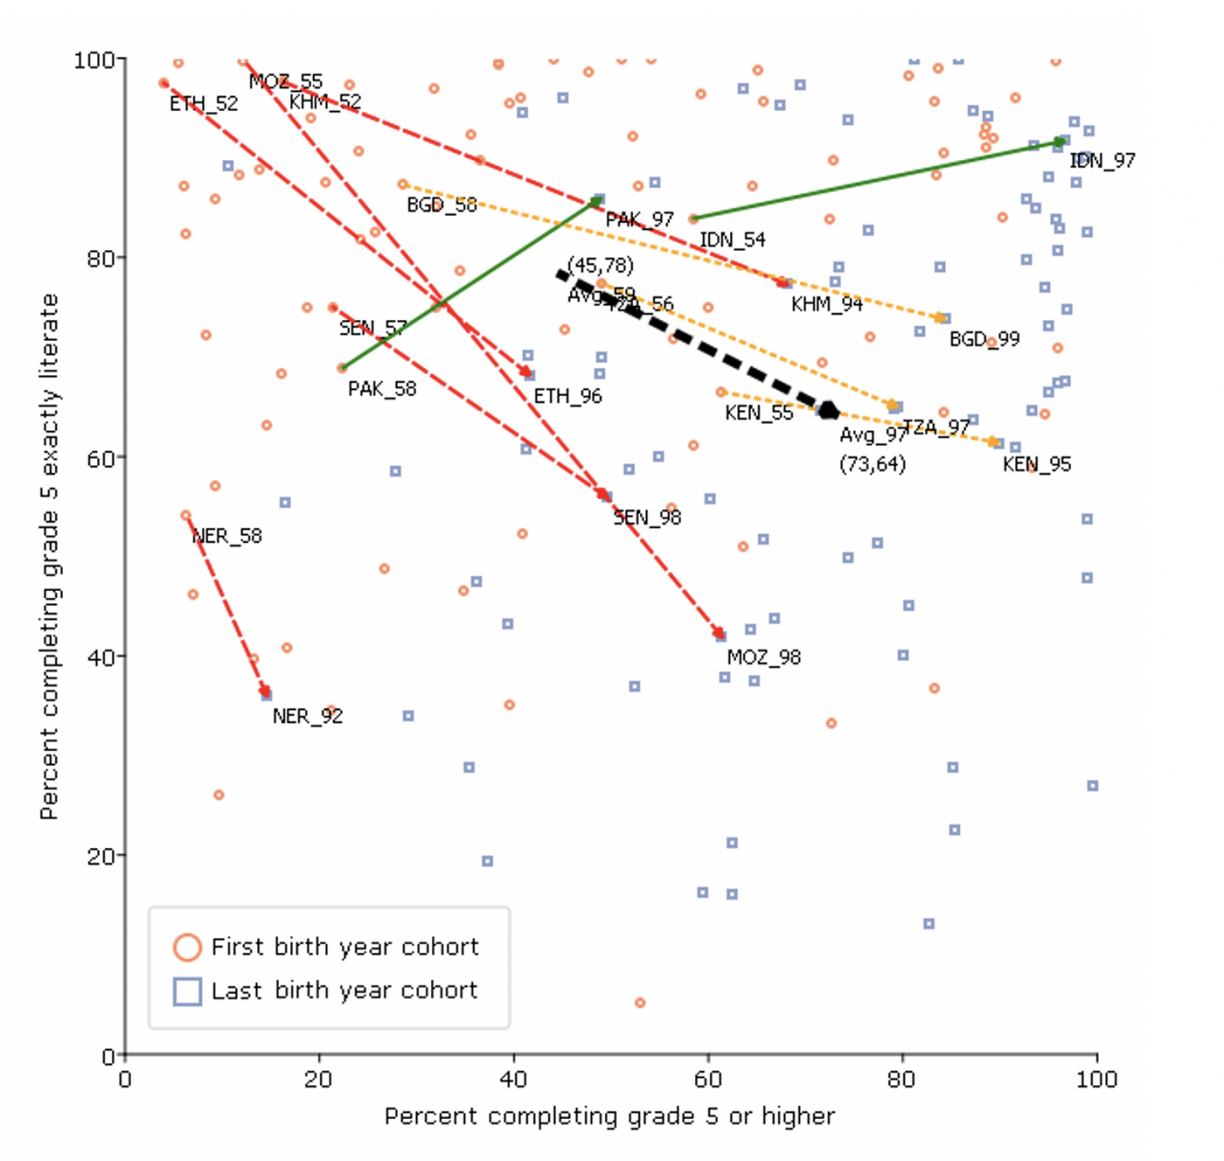
Source: Author’s figure based on Le Nestour, Moscoviz, and Sandefur 2021, A.4 Table 7. Green: Read@G5 rising. Yellow: Read@G5 falling but total fall less than average. Red: Read@G5 total fall more than average.
The Le Nestour, Mosocviz and Sandefur 2021 paper is so important because up until now we have quite good data on the expansion of schooling but very sparse (essentially no) internationally comparable data on the long-term trends in learning of those in school. Many recent efforts, such as Angrist, Djankov, Goldberg, and Patrinos 2021, at estimating “human capital” make valiant attempts at comparing the widely disparate sources on learning to create a current estimate (and some amount of recent trajectory) but can provide no evidence about longer term trends.
This information about long-term trends is to my mind vitally important to identifying successful paths to improvement; if we don’t know how we got go where we are we are unlikely to find the path out.
For instance, in a recent RISE paper Martina Viarengo and I analyzed the PISA for Development (PISA-D) data for Zambia and Vietnam and compared the results of socially advantaged children (male, urban, native speakers, non-immigrants) with equal measures of socio-economic status on the PISA measure. Figure 3 (Figure 1 from that paper) shows that a child in Zambia is on the order of 240 PISA points behind an equivalent child in Vietnam (where variation across OECD students is normed to a standard deviation of 100), which means even the poorest Vietnamese child (leftmost of the green line, around 430) is around 80 points above the highest SES (95th percentile) children in Zambia (rightmost of the orange line, at 346). This is consistent with the massive 72 percentage point gap in Read@G5 for the most recent cohort (94.1 for Vietnam and 22.1 for Zambia).
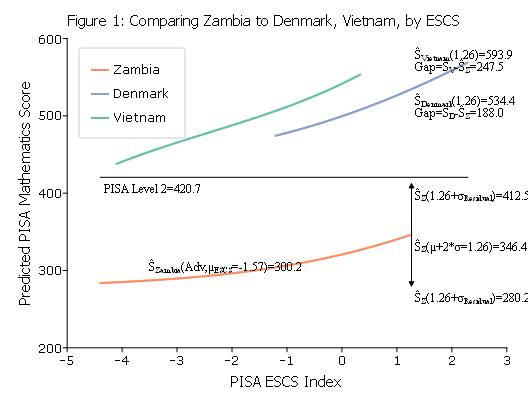
Source: Pritchett and Viarengo 2021.
What this new analysis of the DHS/MICS data shows is that the gap in Read@G5 in the first birth cohort (1958 for Vietnam and 1954 for Zambia, so women who attended school in the early 1960s) was only 11 percentage points. What Figure 2a shows is that the current gap is not a long-term historical feature but rather nearly all of the current gap emerged between the 1960s and the 2000s because of the very different trends in learning outcomes the countries were on (while both were expanding enrollment and the recent cohorts have very similar schooling completion (85.4 percent at Grade 5 or above in Zambia, 88.7 percent in Vietnam).
I have suggested previously (Pritchett 2018 and in chapter 10 in Hickey and Hossain 2019) that a positive “politics” of schooling and learning has to grapple with three questions:
These questions are made even more pressing by this new paper. If countries are on a positive trajectory, then one can imagine that roughly “business as usual” approaches could lead to modest accelerations in performance if perhaps done with more resources, more intensity, perhaps a bit more attention to evidence. But if a country has been on a quite steep downward trajectory of an extended period then it is madness to suppose that anything like “business as usual” is likely to turn the trajectory around (“madness” because crazy is doing the same thing and expecting a different result).
This suggests we need a very different understanding of the system determinants and “what is to be done?” in different countries. In mostly moderately well-performing (say, on PISA-like assessments in the 400 plus range) countries that appear to have been on a long-term upward trajectory like Vietnam, Peru and Indonesia one can think in incrementalist terms.
However in countries like Zambia (ZMB in Figure 2a) or Senegal or Cambodia (SEN and KHM in Figure 2b) where the PISA-D data suggest existing performance among enrolled 15 year olds is in the low 300s to high 200s and the DHS/MICS data suggest the countries have been in long-term decline in Read@G5 (Figure 2a and 2b), an approach that looks only at projects and programs and does not grapple with the deep systemic determinants of learning outcomes seems very much like rearranging deckchairs on the Titanic.
RISE blog posts and podcasts reflect the views of the authors and do not necessarily represent the views of the organisation or our funders.